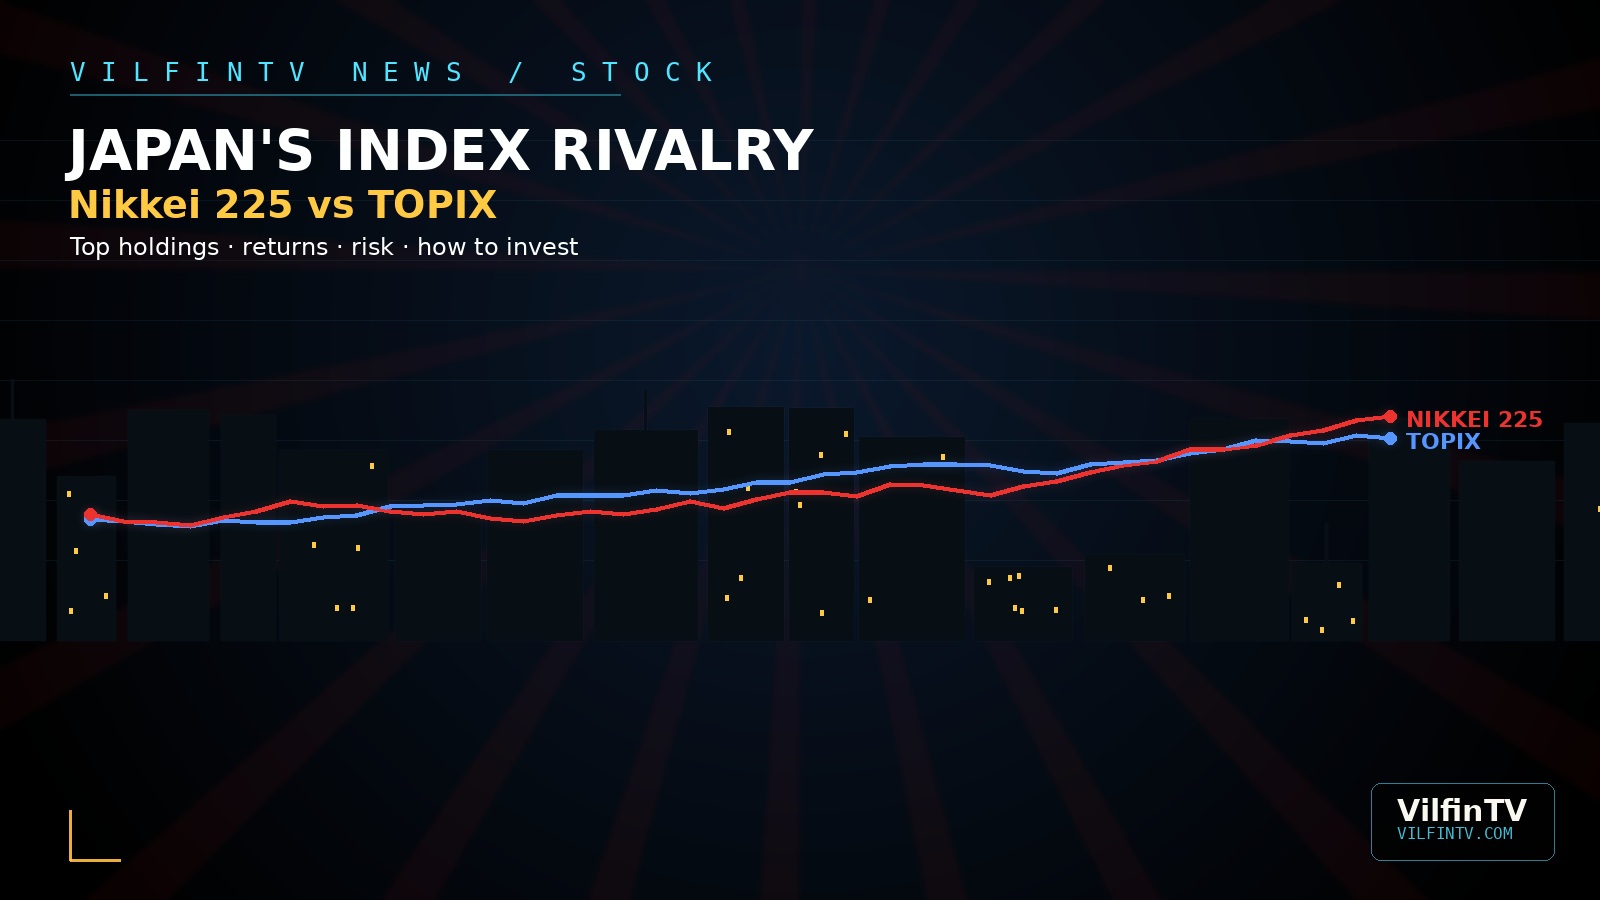
Picture two siblings raised in the same house. Same country, same stock exchange, same decades of boom and bust behind them. But put them side by side and they act nothing alike. One is flashy, jumpy, obsessed with a handful of expensive stars. The other is steady, broad, and quietly represents almost the entire Japanese economy.
That's the Nikkei 225 and the TOPIX — Japan's two headline stock market gauges. An index is simply a scoreboard that tracks a basket of stocks so investors can judge, at a glance, whether a market is winning or losing. In 2026, both scoreboards have been lighting up with record numbers. But they're not measuring the same game the way you'd think.
The Same City, Two Very Different Personalities
Both indices track companies listed on the Tokyo Stock Exchange (TSE), Japan's main stock market. Both have roots stretching back to the aftermath of World War II. Both crashed hard when Japan's asset bubble burst in 1989, and both spent the better part of three decades clawing back to their old highs.
But in 2026, their stories turned into pure drama. The Nikkei 225 smashed through 70,000 points for the first time in its history in mid-June 2026, later hitting a fresh record of 72,353.96. The TOPIX had its own milestone the same month, closing above 4,000 points for the first time ever, later touching 4,101.96 in early July. Two record highs, one country, two very different roads to get there.
What Each Index Actually Measures
The Nikkei 225 is a price-weighted index of 225 major companies on the Tokyo Stock Exchange. Price-weighted means something specific and a little strange: a stock's raw share price, not the size of the company behind it, decides how much it moves the index. A company whose shares trade at 50,000 yen swings the Nikkei far more than a company whose shares trade at 500 yen — even if the cheaper stock's company is actually worth more in total. That quirk has made Uniqlo owner Fast Retailing and chipmaking-equipment giant Tokyo Electron, both known for very high per-share prices, the index's biggest single movers, alongside names like SoftBank Group and Advantest. Nikkei Inc. (the company behind the Nikkei newspaper) has calculated and published the index since 1970, reviewing its 225-company roster twice a year.
The TOPIX, short for Tokyo Stock Price Index, works the opposite way. It's a float-adjusted, market-capitalization-weighted index. Market cap is just a company's total value on paper — its share price multiplied by all its shares. Bigger companies get more say, smaller ones get less — the same logic used by most major indices worldwide, including America's S&P 500. "Float-adjusted" means the calculation only counts shares that actually trade freely on the market, ignoring shares locked up in corporate cross-holdings or founder stakes. TOPIX went through a major overhaul after the Tokyo Stock Exchange's 2022 market restructuring, trimming roughly 400 smaller, thinly-traded stocks from its ranks. As of early 2025, TOPIX covered around 1,716 companies — essentially the whole Prime Market, Tokyo's tier for large, established firms. It's calculated and published by the Japan Exchange Group (JPX), the operator of the Tokyo Stock Exchange itself.
Who Sits at the Top of Each Index
Because the two indices weigh companies so differently, their leaderboards barely overlap. Toyota, one of Japan's largest companies by market value, is a modest presence in the Nikkei but the undisputed heavyweight of TOPIX. Fast Retailing is the reverse story: a huge force in the Nikkei because of its expensive shares, yet barely a blip in TOPIX's cap-weighted math.
| Nikkei 225 (price-weighted) | TOPIX (market-cap weighted) |
|---|---|
| Fast Retailing (Uniqlo) | Toyota Motor |
| Tokyo Electron | Sony Group |
| SoftBank Group | Mitsubishi UFJ Financial Group |
| Advantest | Keyence |
| Fanuc / TDK / Shin-Etsu Chemical | Hitachi / Honda |
By recent estimates, Toyota's weight in TOPIX has been roughly 4.5%, with the top ten TOPIX companies together making up around a fifth of its total weight. That's a very different picture from the Nikkei, where a single stock's price move can swing the whole index in a way no single company can in TOPIX.
The Scoreboard: Recent Performance
Both indices have had a spectacular run, but not an identical one. Over the trailing twelve months into mid-2026, the Nikkei 225 gained roughly 75%, while TOPIX gained roughly 44% over a comparable period. That's a striking gap for two indices tracking the same market — a direct fingerprint of price-weighting amplifying strength in a handful of expensive tech and export-linked stocks.
| Nikkei 225 | TOPIX | |
|---|---|---|
| Recent 12-month change | ~75% | ~44% |
| 2026 record high | Above 70,000 (June 2026) | Above 4,000 (June 2026) |
| Pre-2026 historic peak | 38,915.87 (Dec. 1989) | Well below its 2026 peak in the 1989 bubble era |
| 2008 crisis low | 6,994.90 | Fell to its own multi-decade low |
Both numbers tell the same underlying story — Japanese stocks have had one of their best stretches in decades — but the Nikkei's price-weighting has stretched that story into a taller tale.
Why One Is the Wild Sibling
Here's the plain-English version of why the Nikkei tends to be the jumpier of the two. Because a handful of high-priced stocks like Fast Retailing can each account for a huge slice of the index's total movement, a single earnings report or stock-split decision at one company can yank the whole Nikkei around. That's a form of volatility — how sharply and unpredictably a price bounces around — driven by concentration rather than the health of the broader economy.
TOPIX, spreading its weight across roughly 1,700 companies and letting company size do the talking, tends to move more in line with how Japan's economy as a whole is actually doing. Fund managers and economists widely treat TOPIX as the more faithful economic mirror. The Nikkei, meanwhile, gets compared to the Dow Jones Industrial Average in the U.S. — a famous, closely watched number that isn't actually built to be the most representative one.
Where Analysts Think This Goes Next
Nobody credible is calling the next twelve months with certainty, but the mood among strategists has turned notably upbeat. J.P. Morgan has repeatedly raised its Nikkei 225 target as the rally accelerated — from 61,000, to 70,000 in April 2026, to 75,000 by mid-2026 — a reminder that even professional forecasts keep getting overtaken by a fast-moving market. BlackRock's iShares strategists have flagged 2026 as a potentially strong year for Japanese equities, pointing to corporate reforms and renewed foreign buying as tailwinds. WisdomTree strategist Christopher Gannatti summed up the mood more bluntly in a note titled "Japan Is Back."
The Bank of Japan has been a central character in this. After decades of near-zero interest rates, it raised its policy rate to 1% in 2026 — its highest level since 1995 — as signs mounted that Japan had genuinely exited its long deflationary era. Prime Minister Sanae Takaichi's political win has added fuel: foreign investors poured ¥1.78 trillion into Japanese stocks in a single week in February 2026 — the largest weekly inflow since November 2014 — part of roughly ¥9.7 trillion (about $60 billion) in foreign buying over the first half of 2026 alone. Corporate governance reform is the other pillar of the bull case: Tokyo Stock Exchange pressure on companies to justify low stock valuations has driven record share buybacks — expected to hit roughly ¥20 trillion in the year to March 2026 — and a wave of companies unwinding old cross-shareholdings that used to shield management from shareholder pressure.
The flip side, which some strategists raise as a real risk rather than a footnote, is how far and fast prices have already run, and how much depends on the Bank of Japan continuing to move gradually rather than abruptly on rates — a misstep there could rattle both indices at once.
How an Everyday Investor Could Get Exposure
The most common route is an ETF — an exchange-traded fund, essentially a basket of stocks bundled into a single security you can buy like a stock, built to track an index's performance. Some ETFs track the Nikkei 225 specifically, such as the Tokyo-listed Nomura/NEXT FUNDS Nikkei 225 ETF (ticker 1321) or globally accessible options like the iShares Nikkei 225 UCITS ETF. Others track TOPIX, including Tokyo-listed funds like Daiwa ETF-TOPIX (1305), Nomura TOPIX ETF (1306), and Nikko Exchange Traded Index Fund TOPIX (1308). None of this is a recommendation of any specific fund — it's simply how this kind of exposure typically works, and the details (fees, currency exposure, how closely a fund actually tracks its index) vary and are worth checking before anyone puts money down.
So Which One Wins?
Neither, really — and that's the honest answer. The Nikkei 225 makes for better headlines: it's punchier, more volatile, and swings on individual company stories in a way that can hand sharp-eyed investors real short-term moves, alongside real short-term pain. TOPIX is the tortoise to the Nikkei's hare — broader, calmer, and generally considered the more accurate barometer of how Japan's actual economy is faring. An investor chasing bigger swings and comfortable with concentrated risk in a small number of expensive stocks might lean toward the Nikkei. An investor who wants something closer to "owning corporate Japan" broadly, with less exposure to any single stock's mood swings, tends to lean toward TOPIX. Both have just had a historic run. Whether that run has more room left is the one thing analysts genuinely disagree on.
This article is for informational and educational purposes only and does not constitute investment advice. Stock market indices, ETFs, and international investing carry risk, including currency risk when investing outside your home market. Past performance, including the record highs discussed here, does not guarantee future returns. Consult a licensed, qualified financial advisor before making any investment decision.