It has not been a kind year for Indian stocks. NIFTY 50 — the index that tracks India's 50 biggest listed companies — opened 2026 at 26,146.55 points. By July 8, it had slid to 23,882.05. That is a fall of almost 9 percent in a little over six months.
Somewhere in the middle of that slide, imagine a saver with Rs 1,00,000 — one lakh rupees — and a decision to make. Not whether to invest. But how to invest it.
Lump sum, all at once? Or a SIP — a Systematic Investment Plan, where you invest a smaller, fixed amount on a regular schedule instead of everything on day one? And if a SIP, how often? Every day? Every week? Every month? Or only on the days the market actually falls?
VilfinTV News ran the numbers on all four SIP approaches, using real NIFTY 50 closing prices from January 1 to July 8, 2026. The question was simple: did timing matter? The answer is yes. And it mattered by more than most people would guess.
First, what is a SIP, really?
A SIP just means splitting your investment into equal, scheduled instalments instead of putting it all in on one day.
The idea behind it is called rupee-cost averaging. When prices are low, your fixed instalment buys more units. When prices are high, it buys fewer. Over time, this averages out your buying price — instead of gambling everything on a single day's price, good or bad.
Four versions of this idea were tested, all starting with the exact same Rs 1,00,000 budget:
Daily SIP — a small amount invested on every single trading day, no exceptions.
Weekly SIP — a larger amount invested once a week, on the first trading day of each week.
Monthly SIP — a still larger amount invested once a month, on the first trading day of each month.
Dip SIP — money invested only on days the index actually fell — specifically, fell by 1 percent or more compared to the day before. No fall, no investment that day.
Same money, different rhythm
This is the part worth underlining. Every strategy got exactly the same Rs 1,00,000. Nobody invested more or less than anyone else.
The only thing that changed was the size and timing of each instalment. Daily SIP made 125 tiny investments of Rs 800 each. Dip SIP made just 23 investments of about Rs 4,348 each, and only on days the market dropped. This is a story about timing, not budget.
The results
All figures below are the actual backtest output — real NIFTY 50 closing prices, real dates, real math.
The setup — same total money, different rhythm:
| Strategy | SIPs made | Per SIP |
|---|---|---|
| Daily SIP | 125 | ₹800 |
| Weekly SIP | 28 | ₹3,571 |
| Monthly SIP | 7 | ₹14,286 |
| Dip SIP | 23 | ₹4,348 |
Every row above adds up to the same ₹1,00,000 total invested — only the number and size of instalments differ.
The results as of July 8, 2026:
| Strategy | Avg. cost/unit | Value now | Return |
|---|---|---|---|
| Daily SIP | ₹24,333 | ₹98,146 | -1.85% |
| Weekly SIP | ₹24,316 | ₹98,216 | -1.78% |
| Monthly SIP | ₹24,280 | ₹98,359 | -1.64% |
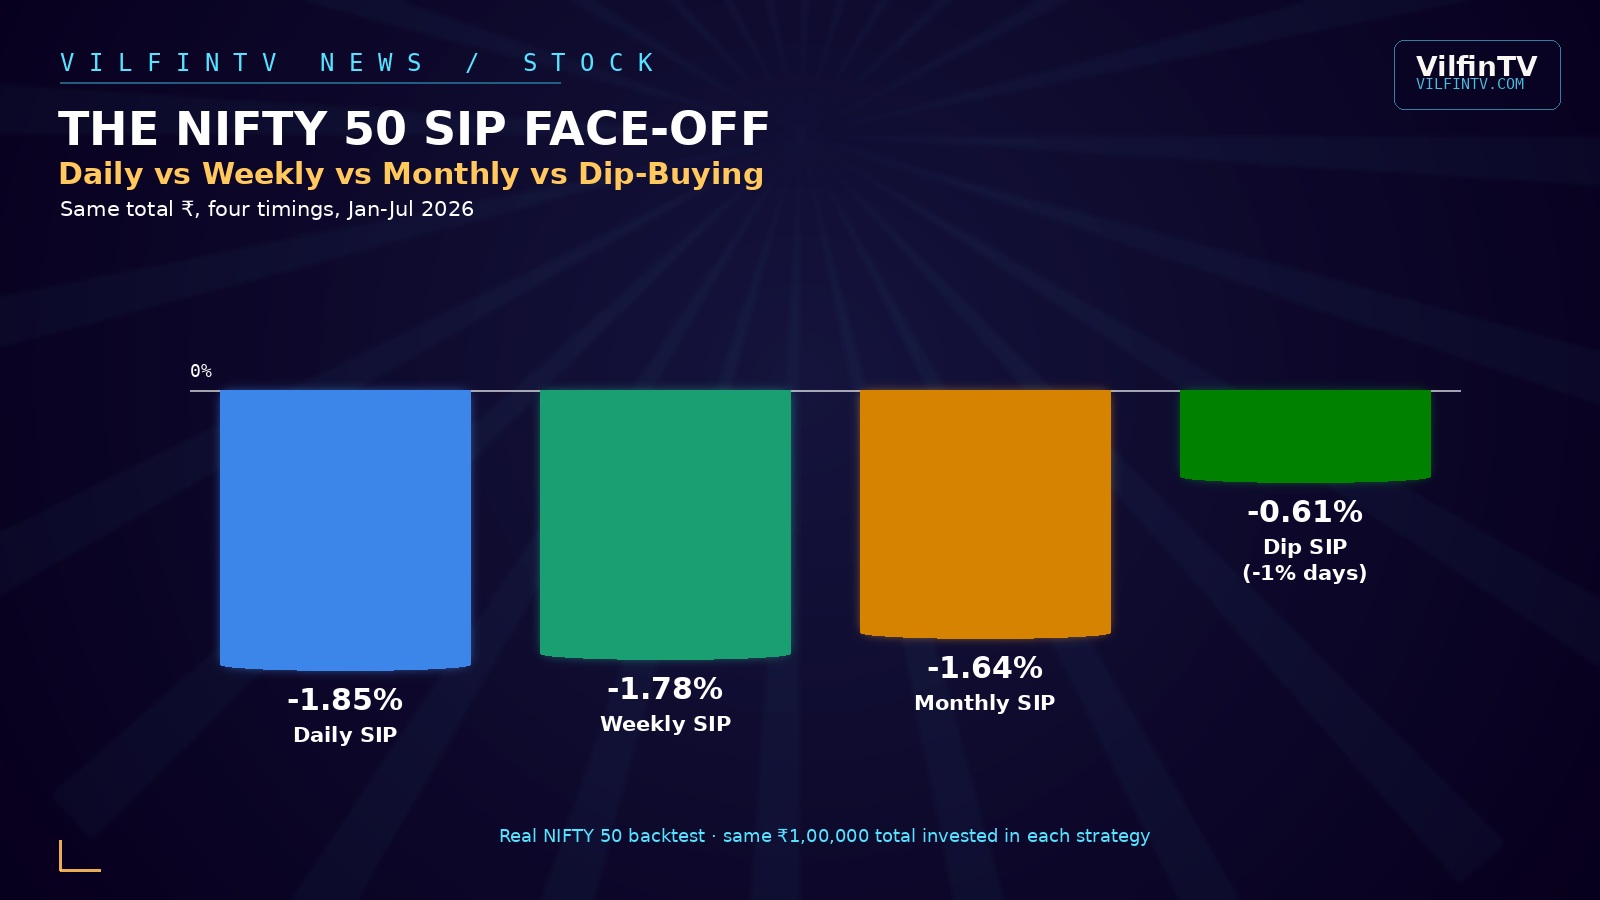
| Dip SIP | ₹24,028 | ₹99,392 | -0.61% |
Why the dip-buyer bled the least
Look closely at one column: average cost per NIFTY unit. That number tells the whole story.
Daily SIP paid an average of Rs 24,333 for each unit of the index. Dip SIP paid an average of Rs 24,028. That gap of roughly Rs 305 per unit does not sound dramatic. But multiplied across every unit bought, it is the entire difference between losing Rs 1,854 and losing just Rs 608.
The reason is simple. Dip SIP only bought on the 23 days the market fell at least 1 percent in a single day. It ignored every calm day and every rising day. That discipline meant it was systematically buying at cheaper prices than the other three strategies, which invested on their scheduled day regardless of what the price was doing.
Those 23 trigger days were not clustered in one week. They were spread across January, February, March, April, May, June and July — with March alone producing 8 of them, as the index tumbled from around 25,000 toward its low point of 22,331.40 that month.
Daily, Weekly and Monthly SIP, meanwhile, finished within a whisker of each other — average costs of Rs 24,333, Rs 24,316 and Rs 24,280 respectively. All three invest on a fixed calendar, blind to price. Monthly edged ahead slightly, mostly because its 7 investment dates happened to land a little more favourably by chance, not because monthly investing has some hidden edge.
The uncomfortable truth: nobody made money
Here is the part that matters most, and it would be dishonest to bury it. All four strategies lost money. Every single one.
That is not a flaw in the backtest. It is the honest result of investing into an index that itself fell almost 9 percent over the period. A SIP does not turn a falling market into a rising one. What it does is reduce the damage — and Dip SIP reduced it the most, cutting the loss by roughly two-thirds compared to Daily SIP.
Rupee-cost averaging is a shock absorber, not an airbag. It softens the landing. It does not stop the fall.
So which SIP wins — really?
The honest answer is: it depends on the kind of market you are in. This backtest covers one very specific kind — a falling one. The picture changes elsewhere.
In a bear market — a sustained fall, like the one NIFTY 50 has been in since January — dip-buying or at least more frequent SIPs (daily or weekly) tend to help, because they keep catching the discount as prices keep sliding. The catch: dip-buying only works if someone is actually watching the market every single day and has cash ready to deploy the moment it falls. Most retail investors, busy with jobs and life, simply do not do this in practice.
In a volatile, choppy market — sharp swings up and down with no clear direction — this is where rupee-cost averaging does its best work. Volatility, in plain terms, just means how much and how fast prices bounce around. NIFTY 50's daily moves over this period swung between a worst day of -3.26 percent and a best day of +3.78 percent. Frequent small investments smooth out that noise far better than a few large monthly lump sums.
In a bull market — a steady climb — timing matters far less, because almost any entry point works out eventually. Here, Monthly SIP, or even a single lump-sum investment, tends to do better than a dip-waiting strategy, because dip-waiting risks sitting in cash while prices keep climbing away from you.
And a genuine caution about Dip SIP, despite it winning this particular round: it demands active, daily attention to prices and ready cash on short notice. That is simply not realistic for most salaried investors, who use automated monthly SIPs precisely because they are hands-off.
The verdict
There is no single "best" SIP strategy. There is only the best strategy for the market you happen to be in, and the level of effort an investor is realistically willing to put in.
For this specific six-and-a-half-month window — a falling, choppy market — more frequent and price-sensitive investing came out ahead. For most ordinary retail investors, though, a plain automated Monthly SIP remains the practical default: low effort, no daily price-watching required, and backed by a much longer track record over full market cycles than this one short window can show.
Six months is a short stretch of market history. This piece describes what happened in exactly this period — not a permanent ranking of SIP strategies for all time.
This article is for information and education only. It is not investment advice. All figures are from a historical backtest over one specific period — January 1 to July 8, 2026 — and do not predict future performance. Past performance does not guarantee future returns. Please consult a licensed, registered financial advisor before starting or changing any SIP.