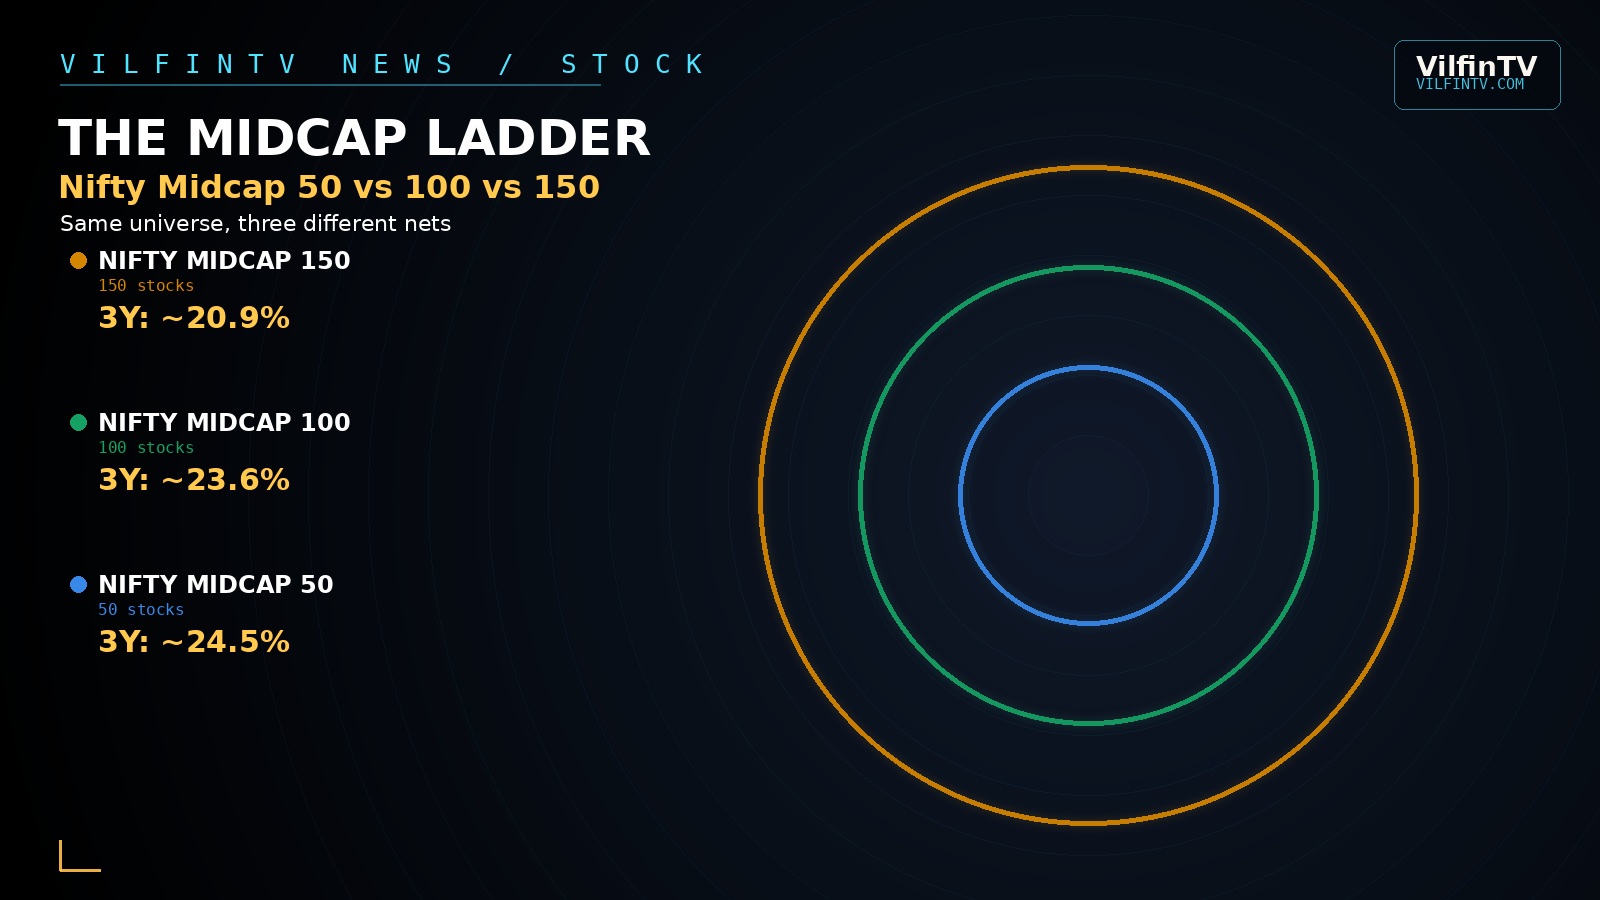
Walk into any Indian investing app today and you'll see three cousins staring back at you: Nifty Midcap 50, Nifty Midcap 100, and Nifty Midcap 150. They sound almost interchangeable. They are not.
All three track India's midcap companies — businesses too big to be called small, but not yet large enough to sit among India's giants like Reliance or HDFC Bank. All three are indices, meaning a basket of stocks bundled together so investors can track (or buy into) an entire slice of the market in one shot, rather than picking individual stocks. But the number in each name — 50, 100, 150 — changes the story completely.
The Sorting Line: Who Gets In, and Where
NSE, India's National Stock Exchange, ranks every listed company by its full market capitalization — simply, the total value of all its shares. The top 100 companies form the Nifty 100 largecap universe. Everyone else is sorted into smaller tiers.
Nifty Midcap 100 picks up where the largecaps end: companies ranked 101st to 200th by full market cap, according to NSE's own index descriptions. Nifty Midcap 150 casts a wider net — ranks 101 to 250 — meaning it swallows the entire Midcap 100 universe and adds another 50 smaller companies below it.
Nifty Midcap 50 works differently, and this is the twist most investors miss. It is not simply "the top 50 by rank." NSE's own methodology document says a company must first belong to the Nifty Midcap 150, then rank in the top 100 of that group by both average trading volume and market cap over the past six months. From that shortlist, the 50 with the largest free-float market cap make the final cut, with a preference given to stocks that also trade in NSE's derivatives (futures and options) market.
In other words, Midcap 50 is the "most-traded, most-liquid, most-established" slice of an already select group — not just the 50 biggest names by size.
What "Float-Adjusted" Actually Means
All three indices use the same weighting method: float-adjusted market-cap weighting. Plain English version — only the shares that are actually free to trade on the open market count. If a company's founders or the government hold a huge chunk of shares locked away, those shares don't count toward the company's weight in the index. And within that free-floating pool, bigger companies simply matter more to the index's performance than smaller ones.
Same Names, Shrinking Weights
Here is where the family resemblance shows. BSE Ltd, the stock exchange operator, sits near the top of all three indices. Polycab India, the cables maker, and Bharat Heavy Electricals (BHEL) show up across all three too. But their weight — how much of the index they represent — shrinks fast as the index widens.
According to data tracked by smart-investing.in in mid-2026, BSE Ltd carried a weight of about 4.14% in Nifty Midcap 50. In Nifty Midcap 100, that fell to roughly 2.40%. By the time you reach Nifty Midcap 150, it was down to about 1.62%. Same company, three very different levels of influence, purely because the pie it's being sliced into keeps getting bigger.
| Rank | Nifty Midcap 50 | Weight |
|---|---|---|
| 1 | BSE Ltd | 4.14% |
| 2 | Polycab India | 3.68% |
| 3 | Bharat Heavy Electricals | 3.37% |
| 4 | Indus Towers | 2.84% |
| 5 | GMR Airports | 2.76% |
| 6 | Marico | 2.75% |
| 7 | Lupin | 2.71% |
| 8 | Mankind Pharma | 2.56% |
| 9 | Hero MotoCorp | 2.53% |
| 10 | Bharat Forge | 2.42% |
| Rank | Nifty Midcap 100 | Weight |
|---|---|---|
| 1 | BSE Ltd | 2.40% |
| 2 | ABB Power Products & Systems India | 2.27% |
| 3 | Vodafone Idea | 2.26% |
| 4 | Polycab India | 2.13% |
| 5 | Bharat Heavy Electricals | 2.03% |
| 6 | GE Vernova T&D India | 1.86% |
| 7 | Billionbrains Garage Ventures (Groww) | 1.80% |
| 8 | Indian Bank | 1.74% |
| 9 | Indus Towers | 1.63% |
| 10 | GMR Airports | 1.60% |
| Rank | Nifty Midcap 150 | Weight |
|---|---|---|
| 1 | BSE Ltd | 1.62% |
| 2 | ABB Power Products & Systems India | 1.61% |
| 3 | Polycab India | 1.37% |
| 4 | Bharat Heavy Electricals | 1.36% |
| 5 | Indian Bank | 1.33% |
| 6 | GE Vernova T&D India | 1.27% |
| 7 | Indus Towers | 1.20% |
| 8 | Vodafone Idea | 1.18% |
| 9 | Bharat Forge | 0.99% |
| 10 | Aditya Birla Capital | 0.97% |
(All figures above from smart-investing.in's index-weightage tracker, dated between April and June 2026. Weightings shift constantly as prices move, and again at NSE's twice-yearly rebalancing in March and September, so treat these as a snapshot, not a fixed fact.)
What the Numbers Actually Show
Fund-level performance data tells a similarly nuanced story — and here, honesty matters more than a tidy headline number. Different fund trackers pulled their data on different days in 2026, so the short-term figures below shouldn't be read as perfectly synchronized. The multi-year, annualized numbers are more stable and more useful for comparison.
| Index (via tracking fund) | 3-Year (annualized) | 5-Year (annualized) |
|---|---|---|
| Midcap 50 (Axis Index Fund, Direct Plan) | ~24.5% | n/a — fund too new |
| Midcap 100 (Motilal Oswal ETF) | ~23.6% | ~27.9% |
| Midcap 150 (Nippon India Index Fund) | ~20.9% | ~17.8% |
That ~24.5% Midcap 50 figure is the annualized (CAGR) return for the fund's Direct plan specifically — worth being precise about, since some trackers list a much bigger-looking "76%" for the same 3-year stretch, which is the cumulative (total, non-annualized) return over all three years combined, not a yearly rate. Same fund, same period, very different-looking number depending on which one you're quoting.
A separate Motilal Oswal Nifty Midcap 150 Index Fund reported an almost identical 5-year figure of 17.83%, which is reassuring — two independent funds tracking the same index arriving at nearly the same number is a decent sanity check.
The 1-year picture is far messier. Depending on the exact date a tracker pulled its numbers in mid-2026, the same Midcap 150 index fund showed anywhere from roughly 5% to roughly 9% over the trailing year, and the Midcap 100 ETF briefly showed a small negative return. None of that is a contradiction — it's a reminder that a single year in midcap stocks can swing hard in either direction, even when the multi-year trend looks strong.
Fewer Stocks, Sharper Swings
Why does the stock count matter so much? Because of a basic rule of investing: spreading your money across more companies reduces the damage any single company's bad news can do to your overall return. That's called diversification.
Nifty Midcap 50 holds its money across just 50 companies, and even more concentrated than that — its top 10 holdings alone made up roughly 30% of the entire index in the data above. A scandal, a regulatory hit, or a bad quarter at one or two of those names moves the whole index noticeably.
Nifty Midcap 150 spreads the same rupee across 150 companies. Its top 10 made up barely 12% of the index. That dilutes the pain from any one stock's bad day — but it also dilutes the gain from any one stock's great day. Nifty Midcap 100 sits in between, both in stock count and in how concentrated its top holdings are.
There's no historical standard-deviation figure precise enough to responsibly print here from the sources checked for this piece, so the qualitative framing above should stand in for it: fewer stocks generally means rougher rides, more stocks generally means smoother ones, and the return data — where the Midcap 50 tracker's 3-year number ran ahead of the broader indices, while its performance in weaker years likely swings harder too — fits that pattern reasonably well.
How Indians Actually Invest In These Today
Nifty Midcap 150 is, by a wide margin, the most "invest-able" of the three off the shelf. Motilal Oswal, Nippon India, and ICICI Prudential all run open-ended index funds tracking it directly, with expense ratios — the annual fee a fund charges, expressed as a percentage of your money — sitting roughly in the 0.22% to 0.30% range depending on the fund and when you check. Motilal Oswal's fund alone manages roughly ₹3,589 crore, according to its own factsheet data.
Nifty Midcap 100 is easiest to access through an ETF (exchange-traded fund, a fund that trades on the stock exchange like a share) — Motilal Oswal runs one, with a 0.23% expense ratio.
Nifty Midcap 50 has real fund options too — Axis Mutual Fund runs a dedicated index fund, with an expense ratio that's recently run around 0.23%, though it has ranged as high as roughly 0.33% at different points — but the shelf is noticeably thinner than for Midcap 150. If you're looking for the deepest and cheapest choice of ready-made products, Midcap 150 currently wins that race by volume of options alone.
Which One Actually Suits You
None of these three is objectively "better." They suit different temperaments.
An investor chasing concentrated, high-conviction exposure to India's most liquid, most actively-traded midsize companies — and who can stomach sharper swings — leans toward Nifty Midcap 50. It's the smallest, most selective, and most fund-manager-vetted of the three by NSE's own screening rules.
An investor who wants the broadest possible net across India's midcap growth story, and is comfortable trading away some concentration in the biggest winners for smoother diversification, leans toward Nifty Midcap 150. It is also, practically speaking, the easiest and cheapest to actually buy today.
Nifty Midcap 100 sits as the middle path — narrower than 150, broader than 50 — for an investor who wants more breadth than the 50 but doesn't need the full 150-stock spread.
The Bottom Line
These three indices are cousins, not clones. They share a market, a weighting method, and even many of the same top companies. But the rules for who gets in, and how many companies share the pie, change the risk and return character of each one meaningfully. Before choosing one, know which trade-off you're actually signing up for — concentration and selectivity, or breadth and smoothness — because the number in the name is not a marketing detail. It's the entire thesis.
Disclaimer: This article is for general information and education only. It is not investment advice, and nothing here is a recommendation to buy or sell any specific fund, ETF, or stock. Past performance, including all return figures cited above, does not guarantee future results. Midcap stocks and the indices built from them carry meaningfully higher risk and volatility than largecap stocks. Please consult a SEBI-registered financial advisor before making any investment decision.