Every morning at 6:30 AM JST, a piece of code reads thirteen unrelated corners of the global financial system — bond yields in Tokyo, jobless claims in Washington, copper futures, the panic gauge on Wall Street — and boils all of it down into a single number. Today that number is 45 out of 100. That sounds almost arbitrary until you actually open the hood and look at what built it, which is exactly what we're doing today: decoding VilfinTV's Daily Market Analysis & Sector Report for July 20, 2026, line by line, so you know not just what the machine concluded, but why — and, just as importantly, which parts of it are worth acting on and which are just noise dressed up as a number.
The Headline Number: 45/100 — "Bullish Leaning / Neutral"
The score runs from -100 (extremely bearish, get defensive) to +100 (full bullish expansion). Today's 45 sits in the second-highest band — close enough to "Bullish Expansion" that five more points across any of the weaker factors below would flip the label entirely.
| Score Range | Regime Label | What It Broadly Means |
|---|---|---|
| +50 to +100 | Bullish Expansion | Broad-based strength — most signals agree, risk-taking is rewarded |
| +10 to +49 | Bullish Leaning / Neutral | (Today: 45) Reasonably balanced, tilted positive — real opportunities exist but so do genuine cracks |
| -10 to +9 | Neutral / Mixed | No clear edge either direction — a coin-flip environment |
| -50 to -11 | Bearish Contraction | Defensive posture warranted — more signals turning negative than positive |
| -100 to -51 | Extremely Bearish / Risk-Off | Capital preservation mode — most "buy the dip" signals are unreliable here |
📖 Quick Glossary: The Terms Decoded, Before We Dive In
The report leans on some genuinely useful jargon — here's what each term actually means, in plain English, so the table below reads like information instead of alphabet soup.
| Term | What It Actually Means |
|---|---|
| VIX ("Fear Index") | The CBOE Volatility Index — built from S&P 500 options prices, it estimates how much the market expects prices to swing over the next 30 days. It's not a price forecast; think of it as the "insurance premium" traders are willing to pay against a rough ride. Higher = more fear priced in; lower = calm, sometimes complacent, markets. |
| Yield Curve | The relationship between how much interest bonds of different lengths pay. Normally, a 30-year bond pays more than a 10-year one, which pays more than a 3-month bill — a healthy "upward" curve. When that flips (shorter-term yields exceed longer-term ones), it's called an inversion, historically one of the more reliable recession warning signs. |
| Credit Spread (High-Yield OAS) | The extra interest riskier "junk-rated" companies must pay to borrow, above what the safest government bonds pay. A wide/rising spread means the market is pricing in more corporate distress; a narrow/tight spread (like today's 2.71%) signals confidence that companies can pay their debts. |
| Liquidity (Fed NFCI) | The Chicago Fed's National Financial Conditions Index — a single composite number covering money markets, bond markets, equities, and shadow banking all at once. Negative means conditions are looser/easier than average (credit flows freely); positive means tighter (credit is getting harder to access). |
| Dollar Strength (DXY) | The US Dollar Index, tracking the dollar's value against a basket of major currencies (Euro, Yen, Pound and others). A stronger dollar makes US imports cheaper but can squeeze emerging-market borrowers who owe debt in dollars. |
| Volatility Term Structure / Contango | Comparing today's VIX against VIX3M (the same gauge, but for 3 months out). When the near-term reading sits below the longer-term one — "contango," the normal shape — it signals calm. The reverse ("backwardation") means near-term panic is running hotter than long-term expectations. |
| Market Breadth (Equal-Weight proxy) | Comparing an equal-weighted index (every stock counts the same) against the standard cap-weighted index (giant companies dominate). It reveals whether a market move is genuinely broad-based or just a handful of mega-caps doing the heavy lifting. |
⚠️ Two Risk Alerts You Shouldn't Skip
Before anything else, the report flagged two momentum warnings: the S&P 500 is trading below its 50-day average, and the Nikkei is trading below its 50-day average. Both are short-term technical warnings, not crashes-in-progress — but they're exactly the kind of thing that explains why the score is 45 and not 65.
What Actually Built the Score: 13 Factors, Point by Point
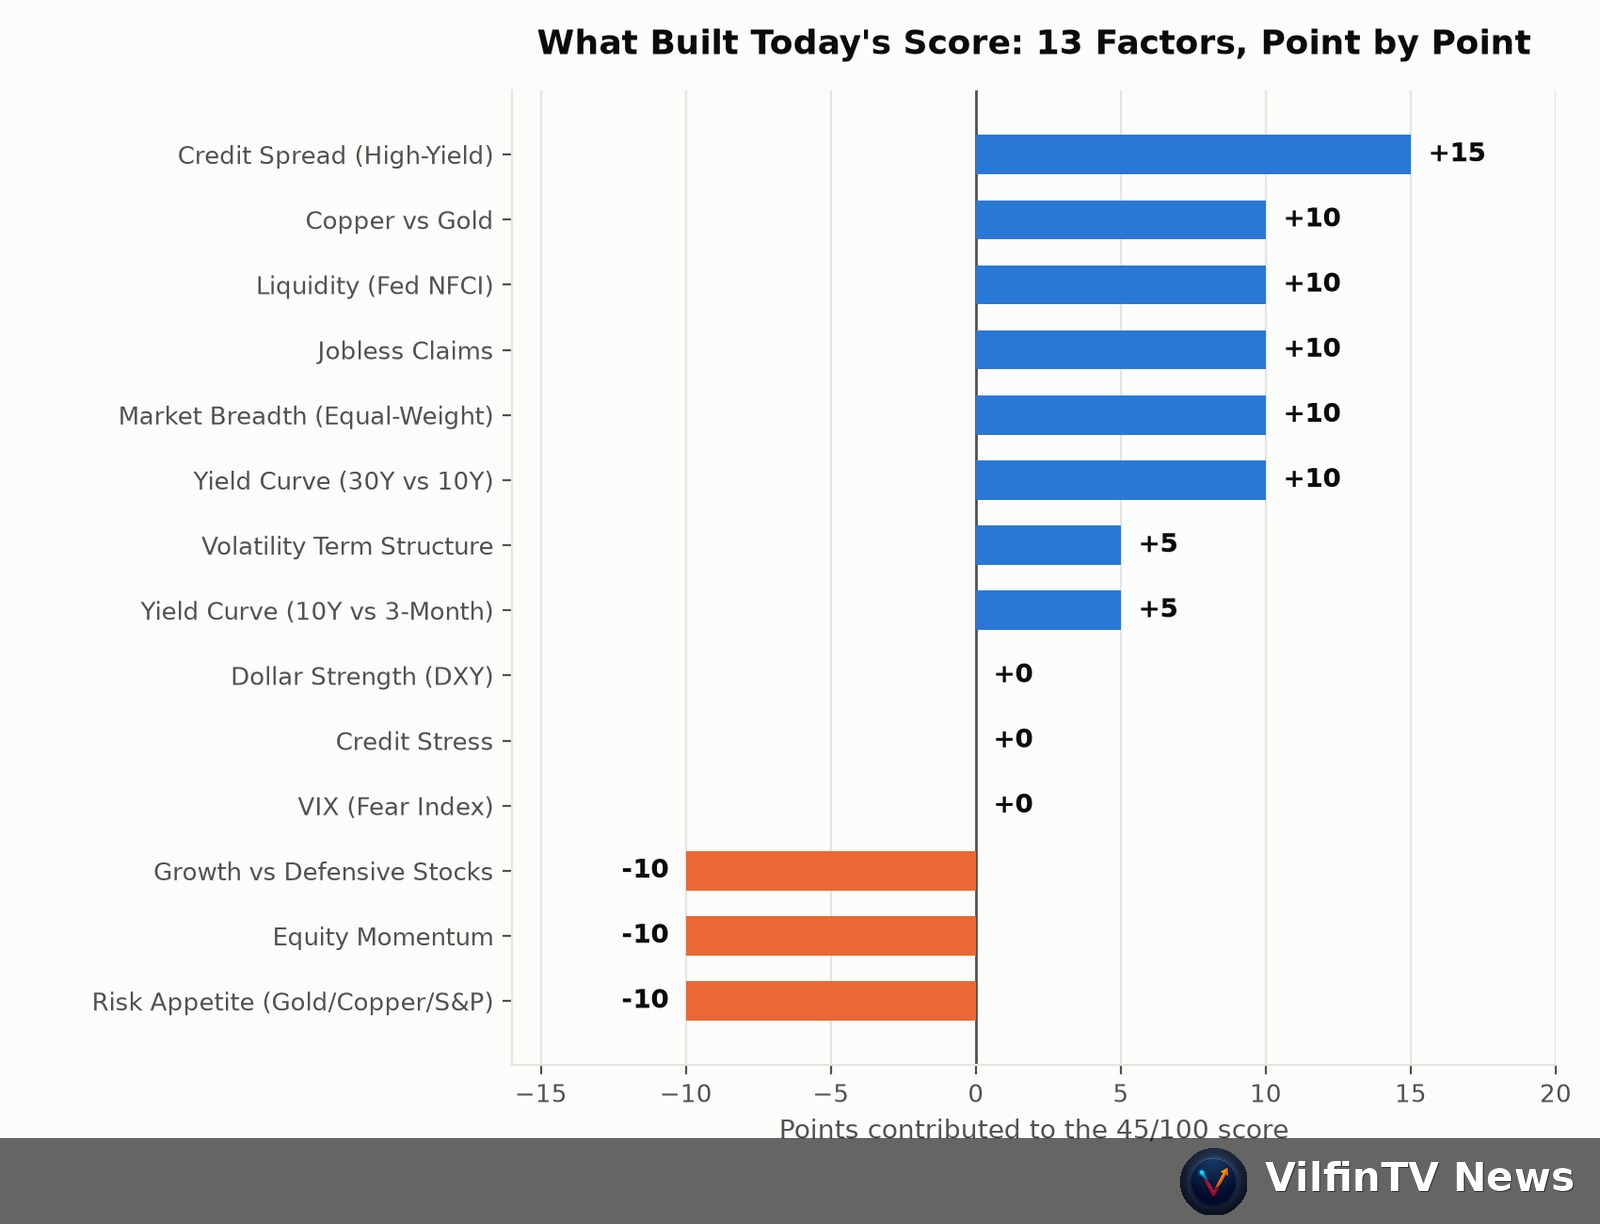
| Factor | What It Actually Showed | Points | Consider or Ignore? |
|---|---|---|---|
| Credit Spread (High-Yield) | Corporate high-yield borrowing spread at 2.71% — tight and calm, well within its recent average | +15 | Consider — the single biggest driver of today's score and a genuinely reliable stress gauge |
| Yield Curve (30Y vs 10Y) | +0.52% spread — healthy, not inverted | +10 | Consider — but a slow-moving signal, won't change day to day |
| Market Breadth (Equal-Weight proxy) | Equal-weighted S&P fell less than the cap-weighted S&P — broader participation than headline losses suggest | +10 | Consider with caveat — explicitly a proxy, not a true advance/decline count |
| Jobless Claims | 208,000 vs a 218,875 recent average — fewer layoffs than usual | +10 | Consider — a real, hard economic data point, not sentiment |
| Liquidity (Fed NFCI) | Chicago Fed index looser than average — easier credit conditions | +10 | Consider — reflects actual financial-conditions data |
| Copper vs Gold | Copper +0.72% vs Gold +0.15% — mild industrial-demand tilt | +10 | Weigh lightly — a single day's move in two commodities, easy to reverse |
| Yield Curve (10Y vs 3-Month) | +0.83%, not inverted | +5 | Consider — another slow-moving, structurally meaningful signal |
| Volatility Term Structure | VIX below its 3-month counterpart (contango) — a calm shape | +5 | Weigh lightly — can flip fast around any shock headline |
| VIX (Fear Index) | 18.77, just above its 20-day average | 0 | Ignore for now — genuinely no signal either way today |
| Credit Stress | High-yield bonds and Treasuries moved together — no divergence | 0 | Ignore for now — neutral reading |
| Dollar Strength (DXY) | Roughly at its 20-day average | 0 | Ignore for now — neutral reading |
| Risk Appetite (Gold/Copper/S&P) | Only 1 of 3 signals agreed — a genuinely mixed read | -10 | Pay attention — internal disagreement like this is itself informative, not noise |
| Equity Momentum | Two of three tracked indices (S&P, Nikkei) below their 50-day average | -10 | Pay attention — same signal as the risk alerts above, a real short-term drag |
| Growth vs Defensive Stocks | Defensive Staples outperformed Discretionary — a cautious tilt | -10 | Weigh lightly — one day's sector rotation, not a trend confirmed yet |
Add it up and the negatives (-30 total, three factors) are outweighed by a broader spread of positives (+75 total, seven factors), landing at 45. The honest read: this isn't a market screaming "buy everything" — it's a market with real structural support (credit markets calm, labor market healthy, yield curve not inverted) fighting against real short-term technical weakness (two major indices below their averages, mixed risk appetite). Both things are true at once.
Where the Report Says to Look: Region & Sectors
Regional pick: Asian Equities. 8 of 15 tracked Asian indices are trading above their 50-day average, led by the Philippines PSEi (+5.72% above its average) — Eastern markets are currently outperforming the West on this measure.
Momentum sector: Energy (+2.51% above its 50-day average, +28.10% year-to-date — the standout performer). Value sector: Energy again — but read this carefully, see the discriminator below. Long-term structural pick: Semiconductors.
Discriminator: Energy Showing Up Twice Isn't Two Confirmations
This is the single most important thing to understand before acting on any of this: the report names Energy as BOTH the "Momentum" pick and the "Value" pick today. That is one sector viewed through two different lenses, not two independent signals agreeing. Momentum asks "what's moving right now" (Energy is, sharply). Value asks "what hasn't caught up yet but has real business fundamentals" (Energy also qualifies, differently). If you bought Energy exposure because you saw it mentioned "twice," you'd actually be taking one concentrated sector bet, not a diversified one — worth knowing before you size a position around it.
Trending Picks: What's Moving Right Now
| Asset Class | Pick | Why It Was Picked | Confidence | Risk / When This Breaks |
|---|---|---|---|---|
| Equity | Energy | +5.42% above its 20-day average, up 1.16% last session | Medium | Short-term momentum reverses fast around news/earnings; invalidated if it closes back below its 20-day average |
| Commodity | Wheat | +11.66% above its 20-day average, up 1.19% last session | Low | Same momentum-reversal risk, and agricultural commodities are especially headline/weather-sensitive |
| Bond | Japan Government Bonds | +0.27% above its 20-day average, up 0.25% last session | Medium | Same invalidation rule — a close back below the 20-day average kills the thesis |
| Currency | USD/CLP (Chilean Peso) | +0.95% above its 20-day average, up 0.73% last session | High | Highest-confidence trending pick today, but still a single-currency bet subject to commodity-price and central-bank surprises |
Quality Picks: What's Been Consistent (Not Necessarily Big)
| Asset Class | Pick | Why It Was Picked | Confidence | Risk / When This Breaks |
|---|---|---|---|---|
| Equity | Energy | Positive across 5 of 5 tracked timeframes | Low | Consistency isn't magnitude — breaks down if 2+ timeframes turn negative |
| Commodity | Wheat | Positive across 4 of 5 tracked timeframes | Low | Same caveat — steady doesn't mean strong |
| Bond | Emerging Market Bonds (EMB) | Positive across 3 of 5 tracked timeframes | Low | The weakest consistency score of the four — treat as the most speculative Quality pick |
| Currency | USD/CLP (Chilean Peso) | Positive across 5 of 5 tracked timeframes | Low | Same caveat as above, despite the perfect consistency score |
Notice every single Quality pick is rated "Low" confidence, on purpose — the report is deliberately conservative about equating "consistent" with "reliable enough to size heavily." Treat the whole Quality list as context, not a shopping list.
The Honest Verdict: What to Actually Weigh vs. What to Let Go
- Weigh heavily: Credit Spread (+15, the biggest single mover and a proven stress gauge), Jobless Claims and Liquidity (+10 each, real economic data not sentiment), and the two Equity Momentum risk alerts (-10, a genuine near-term technical warning worth respecting).
- Weigh lightly: Copper vs Gold, Volatility Term Structure, and Growth vs Defensive rotation — each worth ±5 to ±10 points, but each is a single day's reading that can flip by tomorrow's report.
- Ignore for now: VIX, Credit Stress, and Dollar Strength — all scored exactly 0 today because they're genuinely sitting at "no signal," not because they don't matter generally.
- Treat as one bet, not two: Energy's Momentum + Value double-appearance (see discriminator above).
- Treat as directional color, not a trade list: all four Quality picks, given their uniformly Low confidence rating.
Notable Currency Mover
USD/ZAR (South African Rand) moved +0.51% today — flagged simply because it crossed the report's volatility-alert threshold, not because it's a standalone trade idea.
⚠️ Do your own homework first. Everything above is a data-driven starting point, not a finish line. Before acting on any pick, confidence rating, or sector call in this report, verify the numbers yourself, check the latest news on that specific stock/sector, and size any position according to your own risk tolerance — not the report's. A 45/100 score describes the whole market, not your personal financial situation.
How to Actually Act on This
If the Asian-equities and Energy/Semiconductor themes above are relevant to your own portfolio, here's where to actually place trades:
- For Indian market exposure (Nifty 50 is one of the few tracked indices trading above both its moving averages today): Zerodha or Dhan — Dhan additionally offers direct US stock access via GIFT City if you want the Energy/Semiconductor exposure through US-listed names.
- For index funds/ETFs (a lower-conviction way to play the Asia/Energy themes without single-stock risk): Kuvera, direct plans, zero commission.
- For frequent, high-volume trading on days like this: ProStocks' flat-fee plan.
- For direct access to the broader Asian/global markets behind today's regional pick (170 markets, 40 countries, not just India): Interactive Brokers.
🎁 Using the referral links above benefits you at no extra cost.
Get This Report Every Morning — Completely Free
This full breakdown — score, risk alerts, sector picks, and every Trending/Quality pick with its own confidence and invalidation rule — lands in your inbox every trading day morning, before 9:00 AM JST. Subscribing is completely free, no payment or card required.
If parts of this article felt confusing — that's usually just missing context from not having seen the report itself, not something wrong with you. And if you're completely new to markets: that's exactly who this is for too. You don't need to already understand VIX or yield curves to subscribe; reading a few of these every morning is one of the easiest ways to learn how the market actually behaves day to day and where it might be heading, at no cost.
Conclusion
Strip away the jargon and today's report tells a simple, slightly tense story: the plumbing of the financial system — credit spreads, labor data, liquidity — is calm and healthy, while the surface — two major indices below their averages, mixed risk appetite — is choppier than the underlying data would suggest. That's not a contradiction; it's just what "Bullish Leaning, Neutral" actually looks like up close. The machine gave you 13 numbers and four confidence-rated picks. What you do with them — weigh the credit and labor data heavily, treat the single-day commodity moves lightly, and don't double-count Energy just because it appears twice — is the part no algorithm can do for you.
Disclaimer: This report is for informational and educational purposes only and does not constitute investment advice. Market conditions change daily; confidence ratings and invalidation rules reflect the data available at the time this report was generated. Please consult a licensed financial advisor before making any investment decisions.