Yesterday the machine hit the ceiling: 100 out of 100, the maximum possible reading. Today it's 35 out of 100 — a 65-point swing in a single day. That kind of move looks alarming until you actually open the hood, and what you find inside is far more interesting than a simple "markets got worse" story: it's one specific factor, moving in an unusually synchronized way, doing almost all of the damage, while the deeper economic plumbing barely budged. Here's VilfinTV's full decode of the Daily Market Analysis & Sector Report for July 23, 2026.
The Headline Number: 35/100 — "Bullish Leaning / Neutral"
The score runs from -100 (extremely bearish, get defensive) to +100 (full bullish expansion). Today's 35 sits comfortably in the second-highest band — a real pullback from yesterday's perfect 100, but still net-positive territory, not a warning sign on its own.
| Score Range | Regime Label | What It Broadly Means |
|---|---|---|
| +50 to +100 | Bullish Expansion | Broad-based strength — most signals agree, risk-taking is rewarded |
| +10 to +49 | Bullish Leaning / Neutral | (Today: 35) Reasonably balanced, tilted positive — real opportunities exist but so do genuine cracks |
| -10 to +9 | Neutral / Mixed | No clear edge either direction — a coin-flip environment |
| -50 to -11 | Bearish Contraction | Defensive posture warranted — more signals turning negative than positive |
| -100 to -51 | Extremely Bearish / Risk-Off | Capital preservation mode — most "buy the dip" signals are unreliable here |
⚠️ One Risk Alert Today
Just one flag this time: the Nikkei is trading below its 50-day average — the same warning carried over from recent days. Notably absent today: no S&P or currency-volatility alerts, meaning the score drop below isn't coming from a fresh technical breakdown — it's coming from somewhere else entirely, as the factor table makes clear.
What Actually Built the Score: 14 Factors, Point by Point
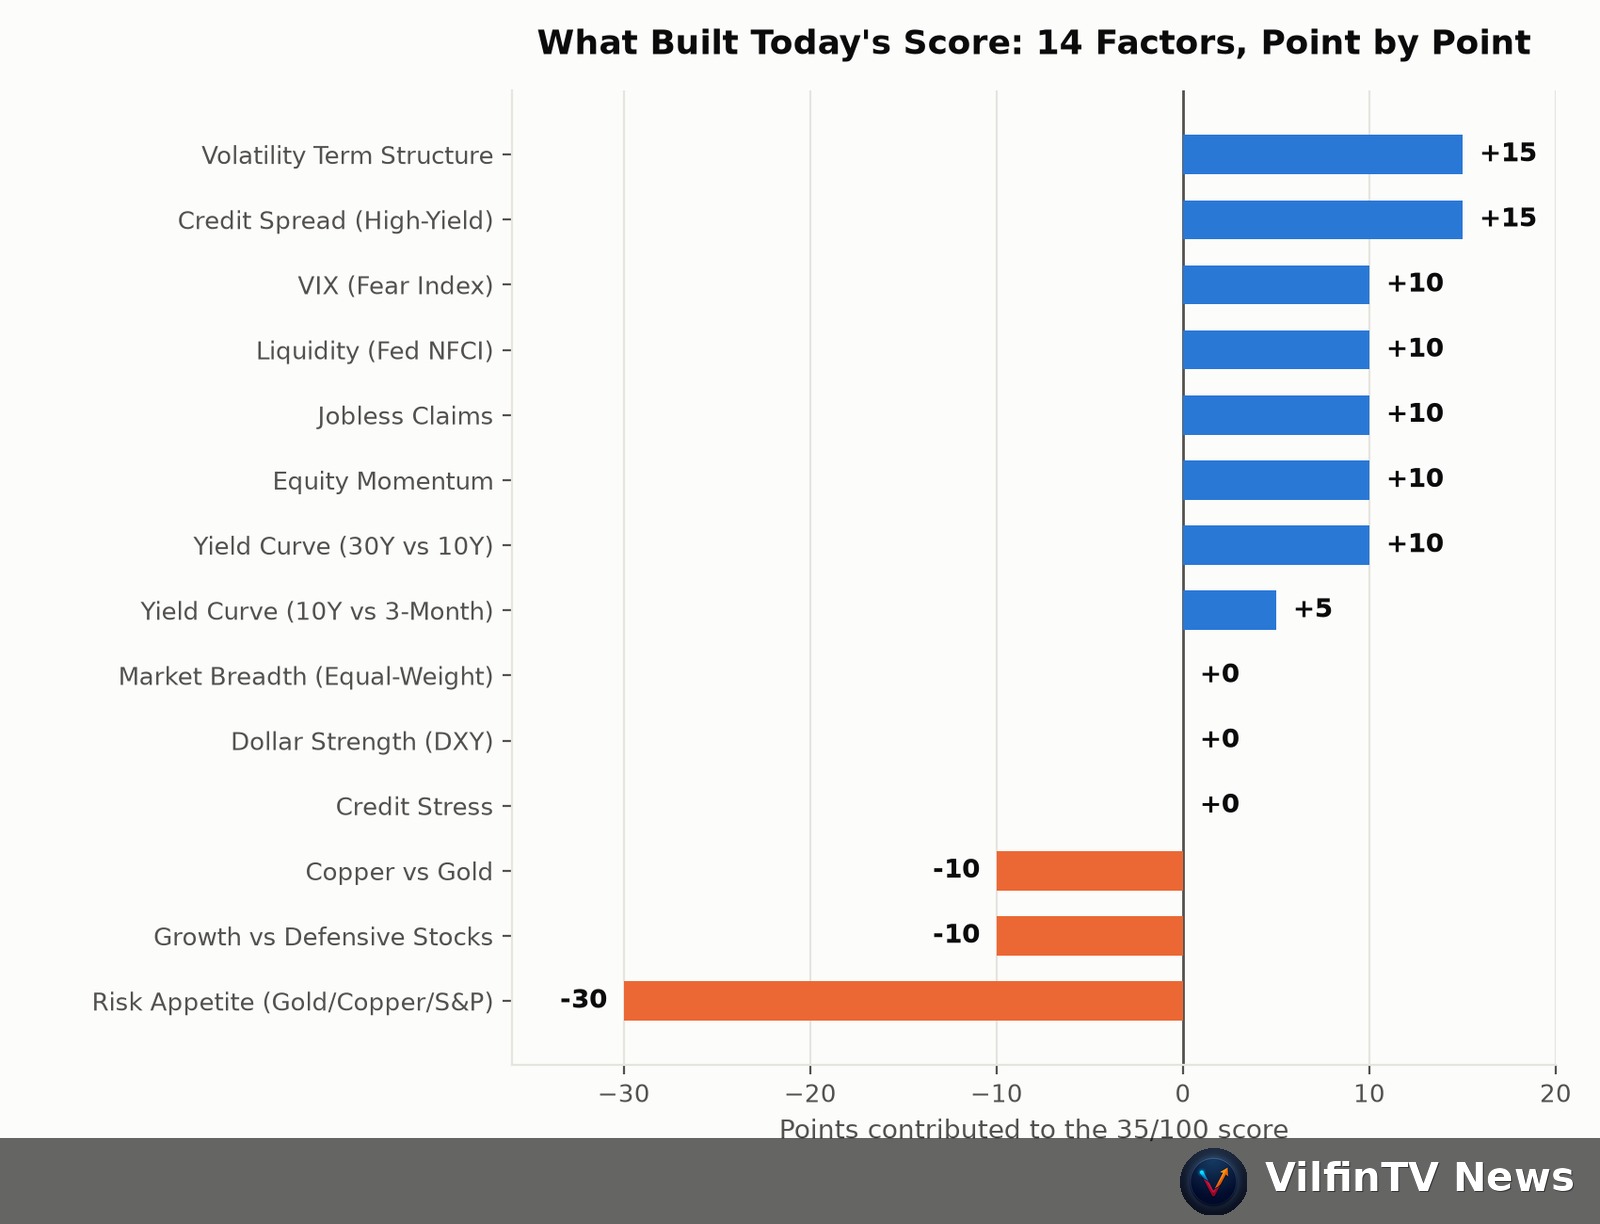
| Factor | What It Actually Showed | Points | Consider or Ignore? |
|---|---|---|---|
| Credit Spread (High-Yield) | Corporate high-yield borrowing spread at 2.69% — tight, healthy credit market | +15 | Consider — the single largest positive driver and a genuinely reliable stress gauge |
| Volatility Term Structure | VIX 16.64 vs VIX3M 19.54 (ratio 0.85) — contango, calm | +15 | Consider, though it can flip fast around any shock headline |
| Yield Curve (30Y vs 10Y) | +0.49% spread — healthy, not inverted | +10 | Consider — a slow-moving signal, won't change day to day |
| Equity Momentum | S&P 500 and Nifty 50 above both moving averages; Nikkei below its 50-day | +10 | Consider with caveat — one of three tracked indices is a real drag, not a clean sweep |
| Jobless Claims | 208,000 vs a 218,875 recent average — fewer layoffs than usual | +10 | Consider — a real, hard economic data point, not sentiment |
| Liquidity (Fed NFCI) | Chicago Fed index looser than average — easier credit conditions | +10 | Consider — reflects actual financial-conditions data |
| VIX (Fear Index) | 16.64, below its 20-day average — calm zone | +10 | Consider — genuinely low fear reading today |
| Yield Curve (10Y vs 3-Month) | +0.91%, not inverted | +5 | Consider — another slow-moving, structurally meaningful signal |
| Credit Stress | High-yield bonds and Treasuries moved together — no divergence | 0 | Ignore for now — neutral reading |
| Dollar Strength (DXY) | Roughly at its 20-day average | 0 | Ignore for now — neutral reading |
| Market Breadth (Equal-Weight proxy) | Equal-weighted and cap-weighted S&P moved almost identically today | 0 | Ignore for now — genuinely flat, no breadth story either way |
| Growth vs Defensive Stocks | Defensive Staples (+0.38%) outperformed Discretionary (-0.74%) — a cautious tilt | -10 | Weigh lightly — one day's sector rotation, not a confirmed trend |
| Copper vs Gold | Copper -0.54% vs Gold +1.32% — a defensive, risk-off tilt | -10 | Weigh lightly — a single day's move in two commodities, easy to reverse |
| Risk Appetite | Gold up, Copper down, S&P down — 0 of 3 signals agreed with a risk-on read | -30 | Pay close attention — the biggest single mover today, and unusually synchronized |
That last row is the actual headline, even though it doesn't look like one at first glance. Risk Appetite normally scores in the ±10 range — today it hit -30, three times its usual weight, because all three of its inputs (Gold, Copper, the S&P 500) moved in the same defensive direction at once, something that happens far less often than each one moving independently. Add up the rest of the table — credit markets, labor data, liquidity, volatility, and the yield curve — and it's almost entirely calm-to-positive. In plain terms: today wasn't a broad "risk-off" day across the economy. It was one specific, unusually synchronized flinch in investor sentiment that dragged an otherwise healthy-looking score down by 30 points on its own.
Where the Report Says to Look: Region & Sectors
Regional pick: US Equities. 4 of 6 tracked US indices remain in a confirmed uptrend, now led by the Dow Jones (+1.66% above its average) — a changing of the guard from the Russell 2000 leadership seen earlier this week.
Momentum sector: Semiconductor (+57.22% year-to-date — even higher than two days ago — while trading 1.99% below its own 50-day average). Value sector: Metals & Mining (-8.72% vs its 50-day average, -3.62% YTD). Long-term structural pick: Semiconductor again — the same Momentum-plus-Long-Term double-appearance flagged in our last two reports, and the same caveat applies: that's one sector viewed through two different lenses, not two independent confirmations, so size any position around it accordingly.
Trending Picks: What's Moving Right Now
| Asset Class | Pick | Why It Was Picked | Confidence | Risk / When This Breaks |
|---|---|---|---|---|
| Equity | Energy | +6.86% above its 20-day average, up 1.20% last session | High | Short-term momentum reverses fast around news/earnings; invalidated if it closes back below its 20-day average |
| Commodity | Brent Crude | +20.34% above its 20-day average, up 4.99% last session | Medium | A sharp one-day jump on top of an already large run — geopolitics/supply-sensitive and prone to fast reversals |
| Bond | No clear short-term momentum | Nothing in the tracked bond universe cleared the trending bar today | Low (fewer than 2 comparable candidates) | N/A until a candidate emerges |
| Currency | USD/CLP (Chilean Peso) | +0.87% above its 20-day average, up 0.04% last session | Low | A single-currency bet subject to commodity-price and central-bank surprises |
Quality Picks: What's Been Consistent (Not Necessarily Big)
| Asset Class | Pick | Why It Was Picked | Confidence | Risk / When This Breaks |
|---|---|---|---|---|
| Equity | Energy | Positive across 5 of 5 tracked timeframes | High | Consistency isn't magnitude — breaks down if 2+ timeframes turn negative |
| Commodity | Brent Crude | Positive across 5 of 5 tracked timeframes | Low | Same caveat — steady doesn't mean strong, and today's Trending pick is the same asset |
| Bond | Emerging Market Bonds (EMB) | Positive across 2 of 5 tracked timeframes | Low | The weakest consistency score of the four — treat as the most speculative Quality pick |
| Currency | USD/ARS (Argentine Peso) | Positive across 3 of 5 tracked timeframes | Medium | A moderate, not exceptional, consistency score |
Worth noticing: Brent Crude shows up as both a Trending AND a Quality pick today — the same "one asset, two lenses" situation as Semiconductor above, just for commodities instead of sectors.
The Honest Verdict: What to Actually Weigh vs. What to Let Go
- Weigh heavily: Credit Spread and Volatility Term Structure (+15 each), Jobless Claims and Liquidity (+10 each, real economic data not sentiment) — the genuine structural backbone of today's score.
- Pay close attention, don't treat as routine: Risk Appetite's -30 — three times its normal weight, and the reason today looks so different from yesterday's 100. Worth watching whether tomorrow shows the same synchronized risk-off pattern or reverts to normal independent moves.
- Weigh lightly: Growth vs Defensive rotation and Copper vs Gold — each a single day's reading that can flip by tomorrow's report.
- Ignore for now: Credit Stress, Dollar Strength, and Market Breadth — all scored exactly 0 today, genuinely flat rather than meaningful.
- Treat as one bet, not two: Semiconductor's Momentum + Long-Term double-appearance, and Brent Crude's Trending + Quality double-appearance.
Notable Currency Mover
USD/BRL (Brazilian Real) moved -0.33% today — flagged simply because it crossed the report's volatility-alert threshold, not because it's a standalone trade idea.
⚠️ Do your own homework first. Everything above is a data-driven starting point, not a finish line. Before acting on any pick, confidence rating, or sector call in this report, verify the numbers yourself, check the latest news on that specific stock/sector, and size any position according to your own risk tolerance — not the report's. A 35/100 score describes the whole market, not your personal financial situation.
How to Actually Act on This
If the US-equities, Energy, or Semiconductor themes above are relevant to your own portfolio, here's where to actually place trades:
- For Indian market exposure: Zerodha or Dhan — Dhan additionally offers direct US stock access via GIFT City if you want the Energy/Semiconductor exposure through US-listed names.
- For index funds/ETFs (a lower-conviction way to play the US/Energy themes without single-stock risk): Kuvera, direct plans, zero commission.
- For frequent, high-volume trading on days like this: ProStocks' flat-fee plan.
- For direct access to the broader US/global markets behind today's regional pick (170 markets, 40 countries): Interactive Brokers.
🎁 Using the referral links above benefits you at no extra cost.
Get This Report Every Morning — Completely Free
This full breakdown — score, risk alerts, sector picks, and every Trending/Quality pick with its own confidence and invalidation rule — lands in your inbox every trading day morning, before 9:00 AM JST. Subscribing is completely free, no payment or card required.
If parts of this article felt confusing — that's usually just missing context from not having seen the report itself, not something wrong with you. And if you're completely new to markets: that's exactly who this is for too. You don't need to already understand VIX or yield curves to subscribe; reading a few of these every morning is one of the easiest ways to learn how the market actually behaves day to day and where it might be heading, at no cost.
Conclusion
Strip away the jargon and today's report tells a story worth remembering: a 65-point swing from yesterday sounds dramatic, but it traces back almost entirely to one factor — Risk Appetite — moving three times harder than usual because Gold, Copper and the S&P all leaned defensive together, a genuinely unusual alignment. Everything else that actually measures the health of the financial system — credit spreads, labor data, liquidity, the yield curve — barely moved and stayed comfortably positive. That's the real lesson of comparing a 100 one day to a 35 the next: the headline number can swing hard while the deeper picture stays remarkably stable, and knowing the difference is exactly what turns a scary-looking score into useful information instead of a reason to panic.
Disclaimer: This report is for informational and educational purposes only and does not constitute investment advice. Market conditions change daily; confidence ratings and invalidation rules reflect the data available at the time this report was generated. Please consult a licensed financial advisor before making any investment decisions.