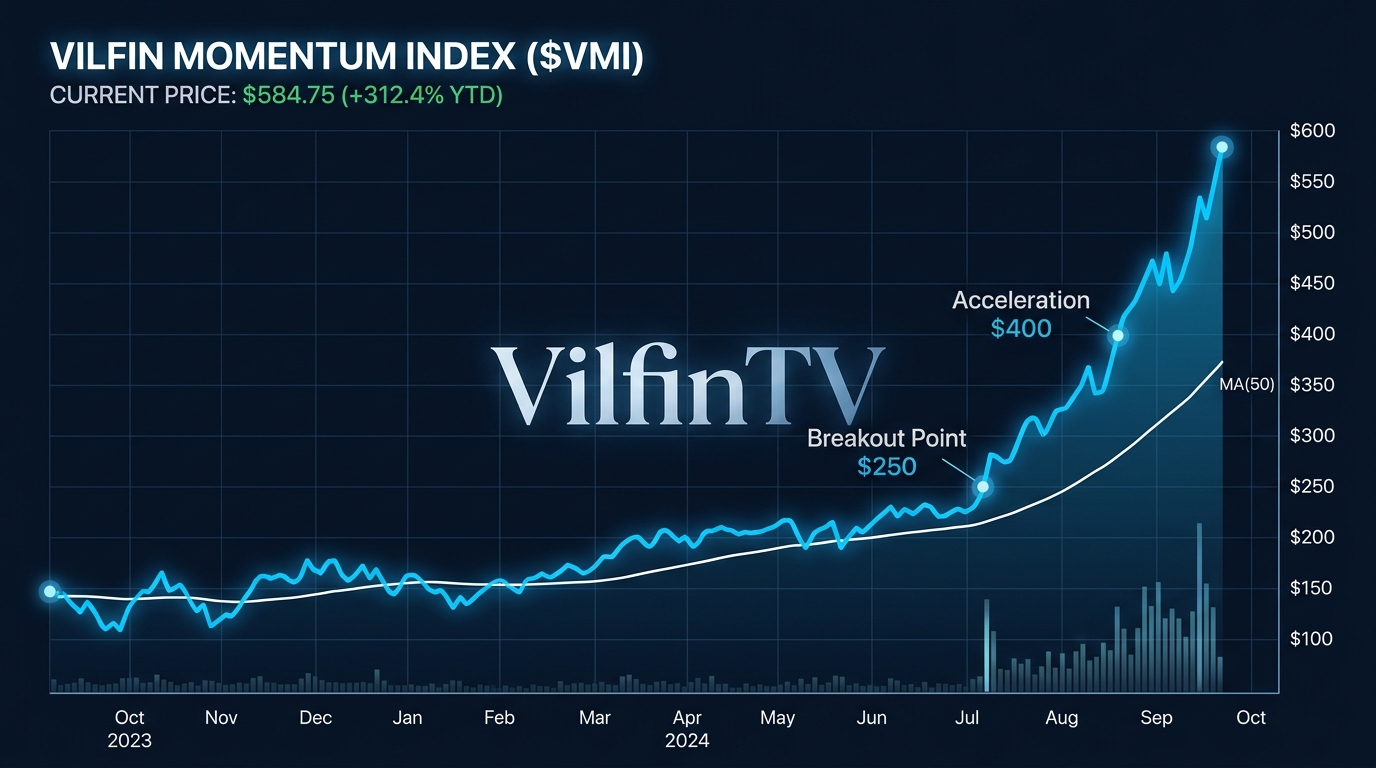
For decades, the Indian retail investor has been conditioned to hunt for "value" or seek out "quality." We are taught to buy the dip, wait for the turnaround, and hold forever. But a quiet, systematic revolution is sweeping through Dalal Street, demolishing traditional stock-picking metrics. It’s called Momentum Investing—a ruthless, unemotional strategy of buying what is already going up and ruthlessly cutting what is going down. Here is the institutional deep-dive into why the Nifty's trend followers are winning, and how the mathematics of momentum is fundamentally rewriting the rules of wealth creation.
The Philosophy of the Trend: Why Momentum Demolishes Value
In traditional finance, we debate over intrinsic value. Is the stock trading below its book value? Does it have a strong moat? Momentum investing strips away all narrative. It operates on a singular, undeniable truth: An object in motion stays in motion.
When you buy a "value" stock, you are often catching a falling knife, hoping the market eventually realizes it’s mispriced. This can lead to years of stagnation—the classic "Value Trap." Quality investing pays massive premiums for great companies, limiting upside. Low Volatility protects the downside but drags in raging bull markets. Momentum wins because it is purely behavioral. It capitalizes on the market's slow reaction to new information. As earnings upgrades trickle in, human psychology hesitates, causing prices to trend upwards over months rather than adjusting instantly. Momentum systems ride this exact wave, cutting losers mercilessly and letting winners compound.
The Nifty Momentum Battleground: Which Index Reigns Supreme?
Not all momentum is created equal. The National Stock Exchange (NSE) offers several systematic momentum indices. We conducted a deep structural comparison of the most prominent strategies, from the large-cap titans to the volatile small-cap arenas.
Deep Dive: Index Methodologies & Rebalancing
Understanding how the National Stock Exchange (NSE) filters these indices is crucial. While pure absolute momentum systems rebalance monthly, the official NSE momentum indices rebalance semi-annually (usually in June and December). This reduces portfolio churn, lowers transaction costs, and minimizes the impact of short-term capital gains tax for ETFs tracking them.
- Nifty 200 Momentum 30: Screens the top 200 large and midcap companies. It calculates a "Normalized Momentum Score" based on 6-month and 12-month price returns, adjusted for daily price volatility. The top 30 stocks with the highest scores make the cut.
- Nifty Midcap 150 Momentum 50: Operates exclusively in the midcap universe (ranks 101-250). It uses the same volatility-adjusted scoring but selects 50 stocks, offering a higher growth beta compared to large caps.
- Nifty Smallcap 250 Momentum Quality 100: A hybrid index. Since smallcaps are highly volatile and prone to manipulation, this index demands both price momentum AND high quality (Return on Equity, low leverage, strong EPS growth). It picks 100 stocks, blending safety with speed.
- Nifty 500 Momentum 50: The ultimate multi-cap momentum screen. It scans all 500 stocks and picks the top 50, allowing it to dynamically shift weightings between large, mid, and small caps depending on where the market's capital is flowing.
Current Top 10 Momentum Stocks (As of July 27, 2026)
Based on recent market trends, the top momentum constituents dominating the Nifty 200 and Nifty 500 Momentum indices are heavily concentrated in defense, power, manufacturing, and consumption breakouts. The Top 10 heavyweights currently driving the momentum engine include:
1. Trent Ltd (Retail Breakout)
2. Hindustan Aeronautics (HAL) (Defense Supercycle)
3. Bharat Electronics (BEL) (Defense Electronics)
4. Zomato (Tech Turnaround)
5. REC Ltd / PFC (Power Financiers)
6. Mazagon Dock Shipbuilders (Shipbuilding)
7. Dixon Technologies (EMS Manufacturing)
8. Cummins India (Capital Goods)
9. BSE Ltd (Financialization of Savings)
10. Tata Motors (Auto Upcycle)
How to Invest: Best Index Funds & ETFs
Retail investors do not need to manually buy and rebalance these stocks. Asset Management Companies (AMCs) offer low-cost Index Funds and ETFs that track these NSE indices perfectly. But before we look at the best funds, you must understand a critical metric: Rolling Returns.
If a fund has a "3-Year Rolling Return of 20% per year", it means that on average, regardless of which random day you invested in the past, you would have made a compounded 20% every single year for the next 3 years. It is the ultimate measure of a strategy's consistency.
The Anatomy of the "Top 20" Momentum System: A Deep Dive
While the Nifty indices provide a solid foundation, institutional-grade absolute momentum—often referred to as the Top 20 Momentum Strategy—is where astronomical wealth is generated. This is not a passive "buy and forget" portfolio. It is a highly active, systematic machine that requires absolute adherence to rules.
1. The Universe & Liquidity Filters
Before any momentum score is calculated, the system must define its playground. Typically, the universe is restricted to the Nifty 500 or Nifty 750 to ensure sufficient liquidity. Penny stocks and ultra-microcaps are immediately discarded. The system demands that a stock must have a minimum average daily turnover (e.g., ₹10 Crores) over the last 6 months. This ensures that when the system issues a "sell" signal, you can exit the position without crashing the stock price.
2. The Red Flags: What Gets Instant Rejection?
Momentum is about buying strength, but avoiding catastrophic blowups is equally important. The system applies ruthless exclusion criteria:
- The 200-SMA Rule: Any stock trading below its 200-day Simple Moving Average (SMA) is instantly rejected, regardless of its short-term returns. If a stock is below its 200-SMA, it is in a long-term downtrend. Momentum systems do not bottom-fish.
- Surveillance Measures (ASM/GSM): Stocks placed under the Additional Surveillance Measure (ASM) or Graded Surveillance Measure (GSM) by SEBI are eliminated. These lists are red flags for potential price manipulation or extreme unwarranted volatility.
- Circuit Hitters: Stocks that frequently hit upper or lower circuits are excluded. A momentum system relies on the ability to enter and exit freely. A stock locked in a lower circuit is a liquidity trap that can wipe out months of portfolio gains.
- Pledged Promoter Holdings: Advanced systems often filter out companies where promoters have pledged a dangerously high percentage of their shares (e.g., >25%), as this introduces severe tail risk during market corrections.
3. The Scoring & Selection Matrix
Once the garbage is filtered out, the remaining stocks are ranked. The most robust systems do not rely on a single timeframe. They calculate a blended momentum score. For example:
Momentum Score = (6-Month Absolute Return × 0.5) + (12-Month Absolute Return × 0.5)
Some systems adjust this score for volatility (dividing the return by the standard deviation of daily returns). This penalizes erratic stocks and rewards smooth, consistent compounders. The system then selects the Top 20 highest-ranking stocks, equal-weighting them (5% allocation each) to prevent a single stock from dominating the portfolio risk.
4. The Execution Protocol (Monthly Rebalancing)
At the close of the last trading day of every month, the algorithm recalculates the rankings. This is where the emotional iron is tested:
- If a stock in your portfolio drops out of the top threshold (e.g., falls below rank 30), it is mercilessly sold at the open of the next trading day.
- The capital is immediately rotated into the new emerging leaders that have climbed into the Top 20.
- There is no "hope," no "waiting for a bounce," and no reading of quarterly earnings reports. The price action dictates the decision.
5. The Reality of Tax Friction
The continuous buying and selling means this strategy generates significant Short Term Capital Gains (STCG). Following the latest Union Budget, STCG is taxed at 20% in India. Therefore, the gross returns must outpace this substantial tax drag and brokerage slippage. Backtests consistently prove that even after a 20% tax hit, 0.5% STT, and impact costs, the sheer velocity of the Top 20 compounding often obliterates passive benchmark returns.
The Test of Time: When Do You See Results?
If momentum is so powerful, why isn't everyone doing it? Because it demands psychological iron. Momentum is not a get-rich-quick scheme; it is a regime-dependent strategy.
In a raging bull market, momentum looks like genius. But in a choppy, sideways, or sudden bear market, momentum systems suffer "whipsaws"—buying high on false breakouts and selling low when trends fail.
The Horizon: To truly capture the alpha of momentum, an investor requires a minimum horizon of 3 to 5 years. You will underperform the market for months at a time during consolidation phases. The explosive returns come when a new macroeconomic trend emerges, and your system automatically aligns your entire portfolio with the biggest winners of that cycle.
How You Should Execute It
For the retail investor, attempting to manually track, filter, and rebalance a 20-stock momentum portfolio every 30 days is an administrative nightmare that often falls prey to emotional bias. You must automate the execution.
- The Passive Route (Low Friction): Invest via Index Funds or ETFs tracking the Nifty 200 Momentum 30 or Nifty Midcap 150 Momentum 50. This delegates the rebalancing to the AMC, converting STCG churn into long-term capital gains (LTCG) since the fund pays no tax internally on its own rebalancing.
- The Active Route (Maximum Alpha): Utilize algorithmic platforms or Intelligent Search screeners that offer rule-based Top 20 absolute momentum portfolios. You maintain direct equity ownership, but you must strictly follow the monthly rebalance updates without second-guessing the algorithm.
Fact Check: Does Momentum Actually Work?
Before deploying capital, it is critical to separate marketing hype from quantitative reality. Here is the unvarnished fact check on the claims made about momentum investing in India:
- The Returns Claim (30-40% CAGR for Top 20): TRUE (Gross). Historical backtests by major quants over the last 15 years show that a concentrated, monthly-rebalanced Top 20 absolute momentum strategy in India yields between 35% and 42% CAGR. However, this is gross return. After factoring in 20% STCG tax, 0.5% STT, and 1% impact cost/slippage, the net return to the investor is closer to 24-28% CAGR—which still massively outperforms the Nifty 50.
- The Drawdown Risk: SEVERE. Momentum is not a straight line up. In 2008 and the 2018 midcap crash, pure momentum strategies suffered drawdowns exceeding 50%. The strategy is mathematically guaranteed to underperform during sudden, sharp market reversals (V-shaped recoveries) because it takes a few months for the moving averages to flip.
DIY: The Screener.in Top 20 Formula
If you want to manually track and filter a momentum portfolio without paying for algorithmic platforms, you can use India's most popular fundamental analysis tool, Screener.in, to build a proxy for the Top 20 strategy.
Create a new screen on Screener.in and paste the following exact query to filter out illiquid stocks, enforce the 200-SMA red flag, and isolate high-velocity trends:
Market Capitalization > 2000 AND
Current Price > DMA 200 AND
Current Price > DMA 50 AND
Average volume 1Month > 250000 AND
Return over 1year > 30 AND
Return over 6months > 15
How to execute the test:
- Run the query above on Screener.in. This creates your base universe of fundamentally liquid stocks that are in a confirmed medium-to-long term uptrend (above 50 and 200 DMA).
- Once the results populate, click on the "Return over 1year" column header to sort the list in descending order (highest return at the top).
- Select the Top 20 stocks. This is your absolute momentum portfolio.
- Repeat this exact process on the last trading day of every month. If a stock falls out of the top 20, sell it and replace it with the new entrant.
You must always do your own rigorous homework before buying any stock. We strongly advise consulting with a SEBI-registered financial advisor to apply additional fundamental filters (such as debt-to-equity, cash flow analysis, and promoter pledge) to get the correct stocks suited for your personal risk profile.
VilfinTV Comment & Conclusion
Momentum investing requires you to abandon ego. You must accept that you don't know what a company is "worth"—you only care about what the market is willing to pay for it right now. By outsourcing the decision to price action, you eliminate the cognitive biases that destroy retail portfolios. Whether through the steady climb of the Nifty 200 or the violent alpha of a Top 20 screen, adopting a systematic trend-following approach is no longer just an alternative strategy; for the modern investor, it is a mathematical necessity.
Final Verdict for Beginners: If you are new to the markets, attempting to run a manual 20-stock momentum portfolio is extremely dangerous. The psychological toll of extreme volatility, combined with heavy taxation and execution slippage, often destroys retail capital. For 95% of investors, buying a low-cost Momentum Index Fund or ETF is the vastly superior choice over picking individual stocks. The fund house automatically handles the complex risk-adjustments, sector rotations, and rebalancing—completely shielding you from short-term capital gains tax while delivering institutional-grade alpha.
Reference: Market insights and structural momentum logic adapted from deep quantitative backtests, including historical Nifty momentum simulations.
- 🟢 Zerodha (India)
- 🔥 Dhan (India + US)
- 💹 ProStocks (Flat-fee)
- 🌐 Interactive Brokers (Global)
- 🚀 Kuvera (Mutual Funds)
Disclaimer: Mutual fund and stock market investments are subject to market risks. Please read all scheme-related documents carefully before investing. The information provided in this article is strictly for educational and informational purposes only. We are not SEBI registered investment advisors. Please conduct your own research or consult with a certified financial advisor before making any investment decisions based on your personal risk tolerance and financial goals.