Yesterday's report closed at 35 out of 100. Today it's 60 out of 100 — a 25-point jump. Here's VilfinTV's full decode of the Daily Market Analysis & Sector Report for September 09, 2026.
The Headline Number: 60/100
| Score Range | Regime Label | What It Broadly Means |
|---|---|---|
| +50 to +100 | Bullish Expansion | (Today: 60) Broad-based strength — most signals agree, risk-taking is rewarded |
| +10 to +49 | Bullish Leaning / Neutral | Reasonably balanced, tilted positive — real opportunities exist but so do genuine cracks |
| -10 to +9 | Neutral / Mixed | No clear edge either direction — a coin-flip environment |
| -50 to -11 | Bearish Contraction | Defensive posture warranted — more signals turning negative than positive |
| -100 to -51 | Extremely Bearish / Risk-Off | Capital preservation mode — most "buy the dip" signals are unreliable here |
⚠️ Risk Alerts
- Momentum Warning: Nikkei is trading below its 50-day moving average.
- Momentum Warning: Nifty 50 is trading below its 50-day moving average.
- Currency Volatility: JPY/INR surged by 1.76%.
What Actually Built Today's Score: 14 Factors
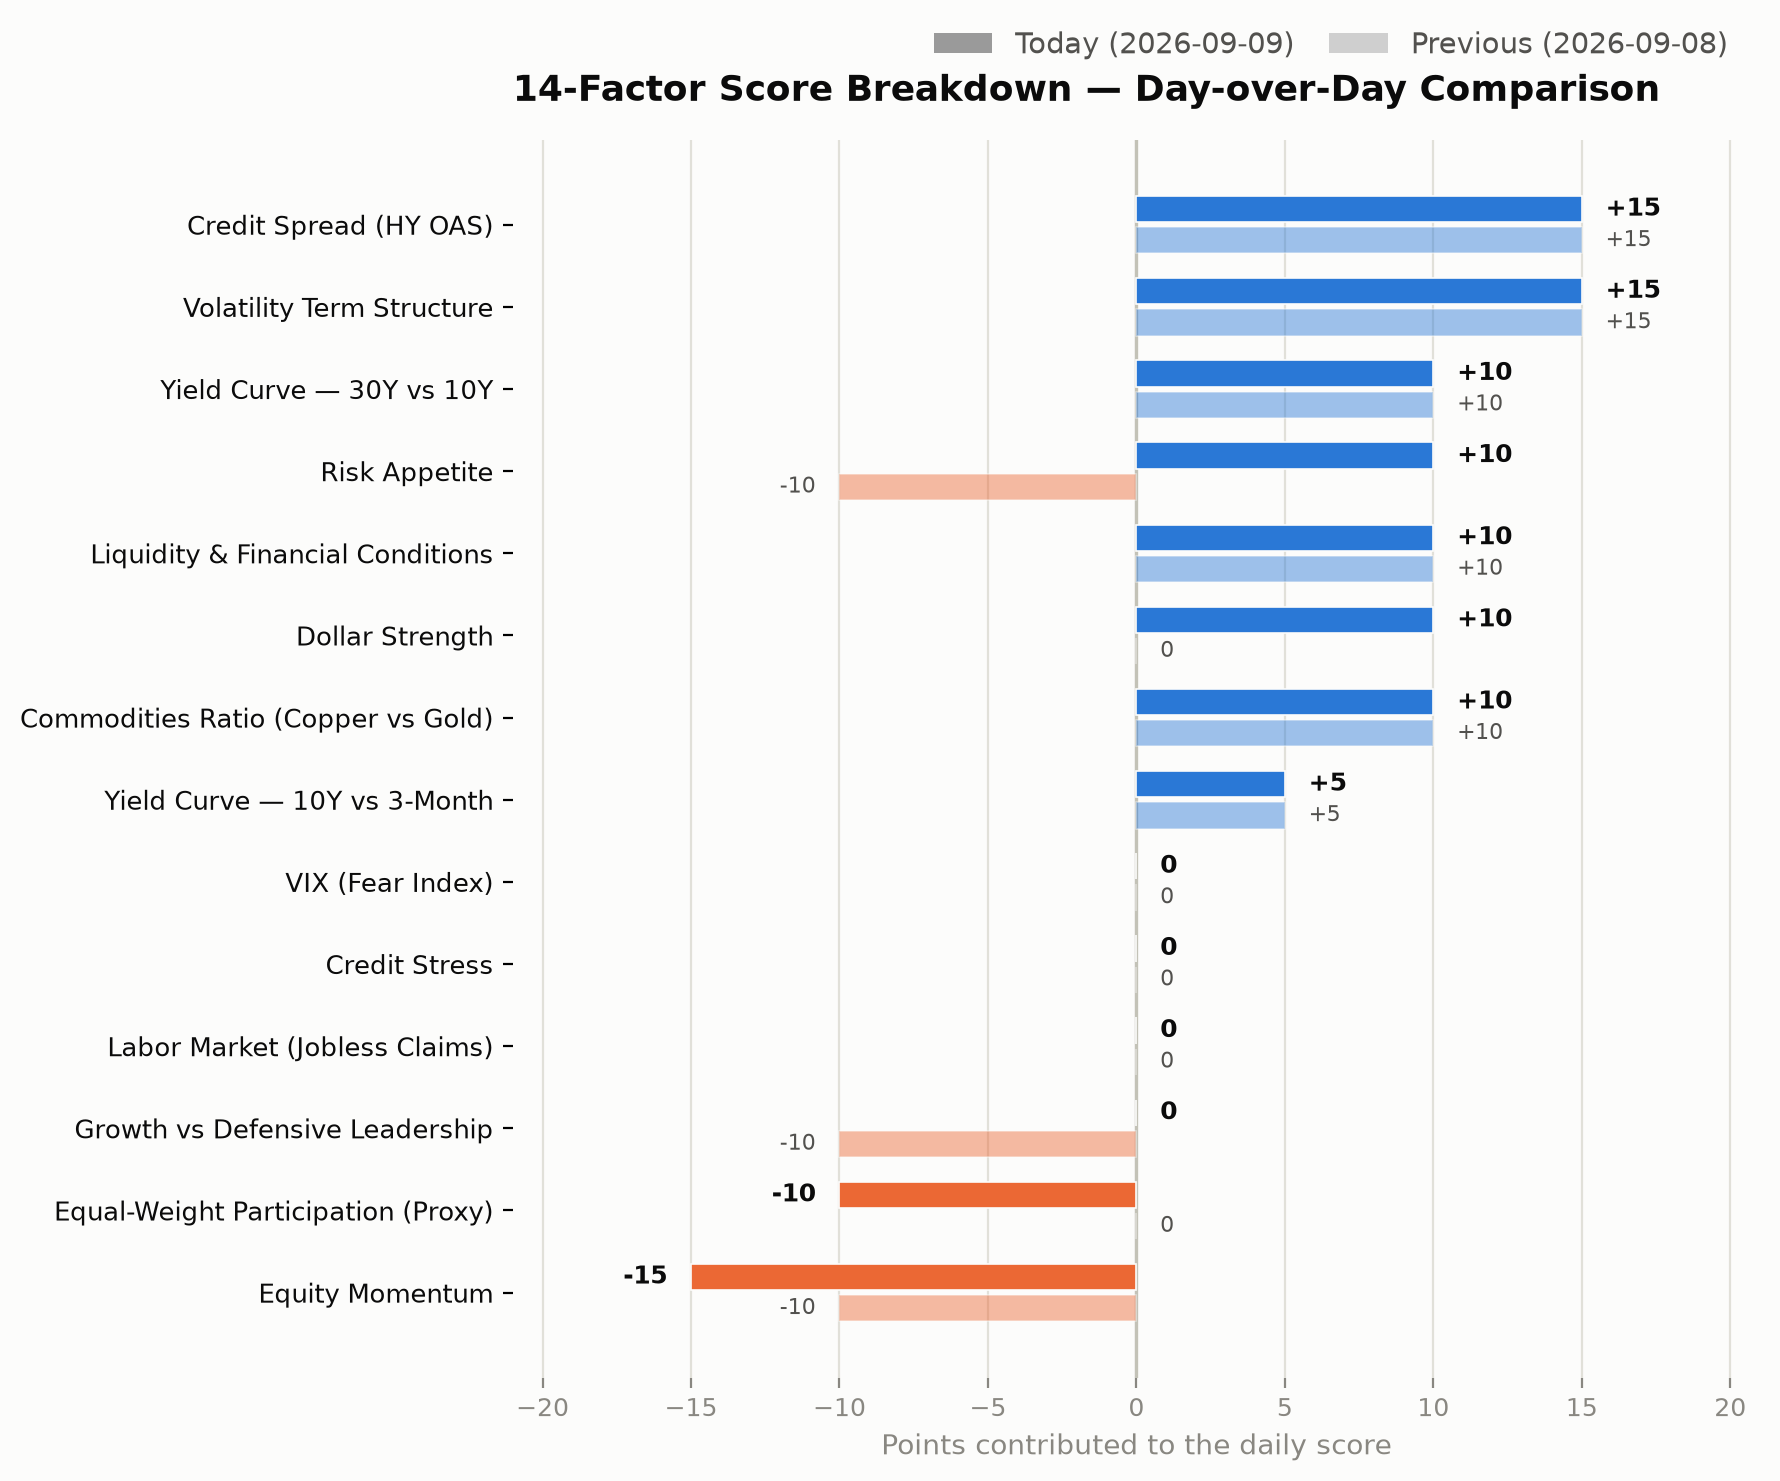
| Factor | What It Actually Showed | Points | Consider or Ignore? |
|---|---|---|---|
| Credit Spread (HY OAS) | ICE BofA US High Yield OAS 2.68% for 2026-09-07 (recent average 2.65%) — tight, healthy credit market | +15 | Consider |
| Volatility Term Structure | VIX 15.72 vs VIX3M 18.39 (ratio 0.85) — contango, calm | +15 | Consider |
| Yield Curve — 30Y vs 10Y | 30Y 5.26% − 10Y 4.81% = +0.46% spread | +10 | Consider |
| Risk Appetite | Gold -0.65% (risk-on), Copper +2.65% (risk-on), S&P -0.58% (risk-off) — 2 of 3 signals agreed | +10 | Consider (was -10 last time) |
| Liquidity & Financial Conditions | Chicago Fed NFCI -0.558 for the week of 2026-08-28 — looser than average | +10 | Consider |
| Dollar Strength | DXY 98.81 vs its 20-day average 99.34 | +10 | Consider (was +0 last time) |
| Commodities Ratio (Copper vs Gold) | Copper +2.65% vs Gold -0.65% (+3.30pp gap) | +10 | Consider |
| Yield Curve — 10Y vs 3-Month | 10Y 4.81% − 3-month 3.78% = +1.03% (not inverted) | +5 | Consider with caution |
| VIX (Fear Index) | 15.72, above its 20-day average (15.11) — no clear signal | 0 | Ignore for now — neutral reading |
| Credit Stress | HYG -0.05%, IEF -0.10% same day — no stress pattern | 0 | Ignore for now — neutral reading |
| Labor Market (Jobless Claims) | 206,000 claims for the week of 2026-08-29 vs 203,125 recent average | 0 | Ignore for now — neutral reading |
| Growth vs Defensive Leadership | Consumer Discretionary (XLY) -0.80% vs Staples (XLP) -0.66% (-0.14pp gap) — sector-rotation proxy, not an earnings/EPS figure | 0 | Ignore for now — neutral reading (was -10 last time) |
| Equal-Weight Participation (Proxy) | Equal-weight S&P (RSP) -1.04% vs cap-weight (SPY) -0.55% (-0.49pp gap) — proxy for breadth, not a true advance/decline reading | -10 | Weigh lightly (was +0 last time) |
| Equity Momentum | S&P 500 above 50-day only (+5), Nikkei below 50-day (-10), Nifty 50 below 50-day (-10) | -15 | Pay close attention (was -10 last time) |
The single biggest mover today: Risk Appetite, which shifted +20 points from yesterday. Nearly everything else in the table below moved little or not at all — check the "was X yesterday" notes for the full picture.
Where the Report Says to Look: Region & Sectors
Regional pick: US Equities. 4 out of 6 tracked US indices are in a confirmed uptrend, led by Nasdaq Composite (+1.48% above MA). US markets show strong relative strength with an average premium of 0.52% over their 50-day trendlines.
Momentum sector: Energy. This sector currently shows the strongest relative momentum among tracked sectors, trading 9.00% above its 50-day average and an explosive +43.84% YTD return. | Value sector: Industrials. Accumulating value, trading -3.66% relative to its 50-day MA and 10.99% YTD. | Long-term pick: Semiconductor
Trending Picks: What's Moving Right Now
| Asset Class | Pick |
|---|---|
| Equity | Blockchain (+5.37% above 20-Day MA, Up +0.46% latest session) |
| Commodity | WTI Crude (+9.74% above 20-Day MA, Up +3.22% latest session) |
| Bond | Japan Govt Bonds (+0.51% above 20-Day MA, Up +0.55% latest session) |
| Currency | JPY/INR (+2.40% above 20-Day MA, Up +1.76% latest session) |
Quality Picks: What's Been Consistent
| Asset Class | Pick |
|---|---|
| Equity | Energy (positive across 5/5 tracked timeframes) |
| Commodity | Wheat (positive across 5/5 tracked timeframes) |
| Bond | Emerging Market Bonds (EMB) (positive across 2/5 tracked timeframes) |
| Currency | JPY/INR (positive across 5/5 tracked timeframes) |
Notable Currency Mover
GBP/JPY (-0.28% today)
⚠️ Do your own homework first. Everything above is a data-driven starting point, not a finish line. Verify the numbers yourself and size any position to your own risk tolerance before acting on any pick in this report.
How to Actually Act on This
- For Indian market exposure: Zerodha or Dhan.
- For index funds/ETFs: Kuvera, direct plans, zero commission.
- For frequent trading: ProStocks' flat-fee plan.
- For broader global market access: Interactive Brokers.
🎁 Using the referral links above benefits you at no extra cost.
Get This Report Every Morning — Completely Free
This full breakdown lands in your inbox every trading day morning, before 9:00 AM JST. Subscribing is completely free.
Conclusion
Today's 60/100 sits in the "Bullish Expansion" band. As always, the headline number is a summary, not a substitute for reading which specific factors actually moved — that's what the table above is for.
Disclaimer: This report is for informational and educational purposes only and does not constitute investment advice. Please consult a licensed financial advisor before making any investment decisions.