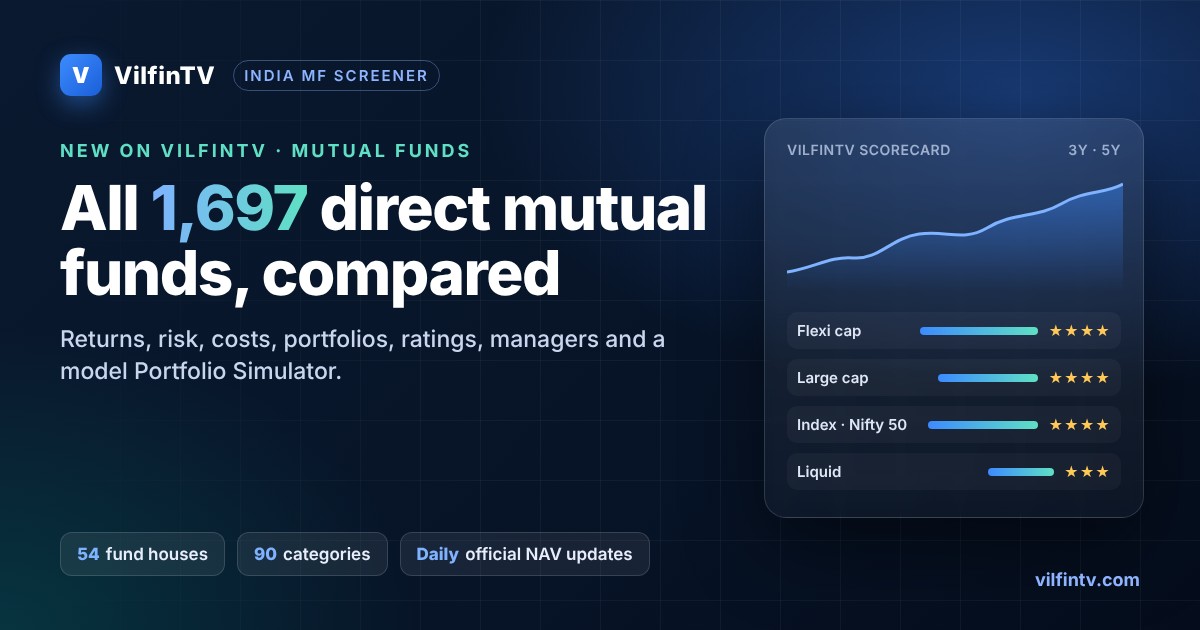
India has more than 1,600 direct mutual fund plans, and most people pick one because a friend mentioned it. VilfinTV's new India MF Screener lets you compare every open-ended Direct-Growth fund on returns, risk, cost and what it actually owns, with everything explained in plain language. It is free to use and needs no login.
🧭 Why Direct plans?
Every mutual fund scheme comes in two versions: Regular (sold through a distributor, who is paid a commission from your money every year) and Direct (bought straight from the fund house, with no commission). Same fund, same manager, same stocks, but Direct usually costs 0.5–1.5% less a year. Over 20 years that difference can add up to lakhs of rupees, which is why the screener covers Direct-Growth plans only.
🔍 Five tabs, one complete picture
| Tab | What you can do |
|---|---|
| 🗂️ Explore | Browse all 1,697 funds across 54 fund houses and 90 categories. Sort and filter by returns, risk, cost, fund size, rating and purchase status, or use ready-made presets such as Trending, Best momentum 3M or Highest returns. |
| 📄 Fund Detail | One page per fund: returns (1 month to 10 years and since launch), risk, costs, exit load, tax, portfolio, managers, documents and a link to the fund's own page on the fund house's site. |
| ⚖️ Compare | Put funds side by side: returns, risk, cost and portfolio overlap. |
| 🆕 NFO | New fund offers that are open or coming soon, with dates and honest tips, including why the “₹10 NFO is cheap” idea is a myth. |
| 🧪 Portfolio Simulator | 20 model portfolios by goal and risk level, explained below. |
⭐ How each fund is judged
- VilfinTV scorecard (3Y / 5Y): Consistency (how often the fund stayed in the top half of its category on rolling 1-year returns), Recency (recent form) and Low volatility, combined 40 / 30 / 30 into one score, with the fund's rank in its category.
- Fund health: a quick High / Average / Low read on Performance, Risk, Cost and Composition, plus Red flags such as a small fund size, paused purchases, high cost, a concentrated portfolio, low-rated bonds or a very deep past fall.
- Index-fund rating: index funds tracking the same index are rated on how closely they follow it (tracking error and tracking difference), cost, size and track record. Lower tracking error is better.
- Returns explained honestly: returns up to one year are absolute, and longer periods are shown per year (CAGR), so they are never mixed up.
🧪 Portfolio Simulator: model portfolios, explained
Choose a goal (time horizon), a risk level (conservative, balanced, aggressive or very aggressive), an amount and how you invest (monthly, weekly, quarterly, yearly or one time). The simulator shows a model mix of up to 8 funds, and every fund has to pass a published checklist covering track record, cost, size, risk, consistency and whether it currently accepts investments. You will see:
- the asset mix across equity, debt and gold / silver, adjusted monthly for market valuations, the interest-rate cycle and global conditions;
- a historical model estimate of the outcome after tax and inflation, not a promise;
- a risk score out of 10, the mix's worst historical fall, and an Economy & Earnings tab (GDP growth, inflation and company earnings for Nifty 50, Next 50, Midcap 150, Smallcap 250 and Microcap 250);
- a Where to park short-term money card for money needed in 0–3 years, comparing liquid, money market, arbitrage and short-duration options after tax at your income slab;
- a beginner's guide (KYC → direct account → fixing your investment day → placing the order) with a full NRI section on KYC, NRE / NRO accounts, US / Canada limits and tax.
Before it opens, a short risk notice asks you to confirm that you understand it is an educational simulation, not advice.
✅ How accurate is the data?
NAVs come from the official industry NAV file and are refreshed within about 30 minutes of being published each day. Every return date is reconciled against official NAV history, and an independent verification script recomputes the numbers before anything is published. If a check fails, the update is held back.
📚 Learn while you compare
The FAQ covers the basics in plain language: what a mutual fund is, Direct vs Regular, index vs active funds, FDs and insurance-cum-investment plans vs mutual funds, starting with ₹500 a month, how many funds you need, SIP vs one-time investing, SWP, tax harvesting, international investing and NRI rules.
🚀 Try it in 60 seconds
- Open the screener and pick a category, for example Flexi Cap.
- Sort by VilfinTV score or 5-year return.
- Open a fund to read its scorecard, Fund health and portfolio.
- Add two or three funds to Compare to check cost and overlap.
- Try the Portfolio Simulator to see how a diversified mix behaves over your time horizon.
VilfinTV is a free, educational project. If it helped you, please share this page with friends and family on WhatsApp. 🙏
- 🪙 Kuvera (Free Direct MF Platform)
- 🟢 Zerodha (India's Largest Broker)
- 🔥 Dhan (India + US Markets)
- 💹 ProStocks (Flat-fee Broker)
- 🌐 Interactive Brokers (Global Markets)
- 📜 IndiaBonds (Bond Investment)
- 🥇 GoldenPi (Bonds & NCDs)
- 💎 Wint Wealth (Fixed-Income Bonds)
- 🌍 Revolut (Multi-currency)
- 💚 Wise (Best Rate Transfers)
- ⚡ Instarem (Asia Remittance)
- 📱 Navi (UPI & Loans)
- 📲 PhonePe
- 🏦 Axis Bank Digital Salary Account
Disclaimer: Mutual fund and stock market investments are subject to market risks. Please read all scheme-related documents carefully before investing. The information provided in this article is strictly for educational and informational purposes only. We are not SEBI registered investment advisors. Please conduct your own research or consult with a certified financial advisor before making any investment decisions based on your personal risk tolerance and financial goals.