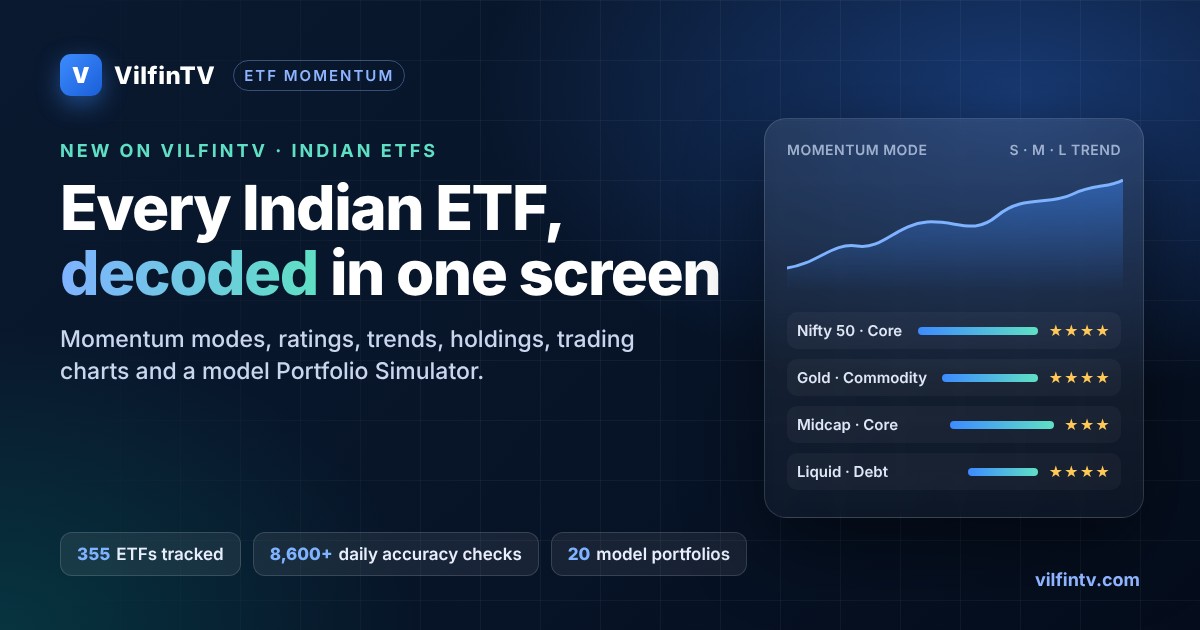
Choosing an ETF in India used to mean opening a dozen tabs. One for the price, one for the expense ratio, another for the holdings, a fourth to check whether anyone actually trades it. VilfinTV's new ETF Momentum page puts all 355 exchange-traded funds listed in India on one screen and explains each of them in plain language. It is free to use and has no login.
🧭 What is an ETF, in one paragraph?
An Exchange-Traded Fund is a basket of investments, such as the 50 Nifty companies, gold, government bonds or US technology stocks, that you buy and sell on the stock exchange just like a share. You need a demat account, the costs are usually very low, and you can see the price change through the day. ETFs are one of the simplest ways to own the whole market instead of guessing individual stocks.
⚡ The big idea: Momentum Mode
Every week, each ETF is compared with a benchmark you choose: Nifty 50, Nifty 500, Bank Nifty and others. Two questions are asked: is it doing better than the market? and is that getting stronger or weaker? The answer puts every ETF into one of four modes:
| Mode | What it means | In simple words |
|---|---|---|
| 🚀 Accelerating | Beating the benchmark, and the lead is growing | In form and getting stronger |
| 🔄 Recovering | Still behind the benchmark, but catching up | Turning the corner |
| 🐢 Decelerating | Ahead of the benchmark, but the lead is shrinking | Still ahead, losing steam |
| 📉 Underperforming | Behind the benchmark and falling further back | Out of form for now |
Modes change as markets rotate, so they describe the current situation, not a forecast. The page also shows a Trend S·M·L label (short, medium and long term: Positive, Neutral or Negative) so you can tell a short-term dip from a long-term downtrend.
🔍 Everything you can do on the page
- Three table views: Momentum (mode and trend), Returns (1 week to 5 years) and Risk & Cost (volatility, worst fall, expense ratio, liquidity).
- Asset-class chips: filter to Equity, Debt, Commodities (gold and silver), Global or Hybrid ETFs in one tap.
- Role tags: each ETF is labelled Core (broad market), Satellite (sector, theme or factor), Commodity, Debt, Global or Hybrid, so you can see what job it does in a portfolio.
- VilfinTV rating (1–5 ★): a single score built from cost, liquidity, tracking accuracy, returns, risk and fund size, compared only with similar ETFs.
- VilfinTV scorecard (3Y / 5Y): consistency (how often it stayed in the top half of its peers), recency (recent form) and low volatility, combined 40 / 30 / 30.
- Factor DNA: shows what really drives an ETF's returns, such as large caps, midcaps, momentum, value, quality or US tech, so two ETFs with different names but the same behaviour stand out.
- Holdings: the ETF's top stocks, sector split and market-cap mix from the latest official monthly portfolio.
- Trading chart: candles or line, 1M to 1Y, with 20 / 50 / 200-day averages, volume and a crosshair that shows open, high, low and close for any day.
- Near-live price: during market hours a "Today as of HH:MM" candle is added about every 30 minutes (delayed, not real-time). The official close replaces it in the evening.
- At a Glance card: a quick checklist for each ETF covering liquidity, premium or discount to its NAV, cost versus peers, track record, fund size and worst fall.
🧪 Portfolio Simulator: model portfolios, explained
The Portfolio Simulator shows 20 model ETF portfolios: 5 time horizons × 4 risk levels (conservative to very aggressive). Pick your goal, risk level, amount and how often you invest (monthly, weekly, quarterly, yearly or one time). The page then shows:
- the asset mix (equity, debt, gold / silver, global), with each ETF passing about 20 quality checks;
- a historical model estimate of returns after tax and inflation, not a promise;
- how many units of each ETF your amount buys, with leftover cash;
- a risk score out of 10, the mix's worst historical fall, and an Economy & Earnings tab that tracks GDP growth, inflation and company earnings;
- a step-by-step beginner's guide, including an NRI section on KYC, accounts and tax.
Before it opens, a short risk notice asks you to confirm that you understand it is an educational simulation, not advice. Markets can and do fall.
✅ How accurate is the data?
Prices and NAVs come from official exchange and fund-house sources and are refreshed every trading day. An independent audit then recomputes the numbers from the raw daily data, more than 8,600 checks on a typical day, and nothing is published if a check fails. The header chip on the page shows how many checks passed.
🚀 Try it in 60 seconds
- Open the page and keep the benchmark on Nifty 50.
- Tap the Equity chip and sort by Rating.
- Open any ETF to see its At a Glance card, holdings and trading chart.
- Switch the view to Risk & Cost to compare expense ratios and worst falls.
- Scroll to the FAQ, which covers how to buy an ETF, iNAV, tax, SWP and tax harvesting in plain English.
VilfinTV is a free, educational project. If it helped you, please share this page with friends and family on WhatsApp. 🙏
- 🪙 Kuvera (Free Direct MF Platform)
- 🟢 Zerodha (India's Largest Broker)
- 🔥 Dhan (India + US Markets)
- 💹 ProStocks (Flat-fee Broker)
- 🌐 Interactive Brokers (Global Markets)
- 📜 IndiaBonds (Bond Investment)
- 🥇 GoldenPi (Bonds & NCDs)
- 💎 Wint Wealth (Fixed-Income Bonds)
- 🌍 Revolut (Multi-currency)
- 💚 Wise (Best Rate Transfers)
- ⚡ Instarem (Asia Remittance)
- 📱 Navi (UPI & Loans)
- 📲 PhonePe
- 🏦 Axis Bank Digital Salary Account
Disclaimer: Mutual fund and stock market investments are subject to market risks. Please read all scheme-related documents carefully before investing. The information provided in this article is strictly for educational and informational purposes only. We are not SEBI registered investment advisors. Please conduct your own research or consult with a certified financial advisor before making any investment decisions based on your personal risk tolerance and financial goals.